2008-09 Season Primers: #25 – Ivy

Posted by rtmsf on October 16th, 2008

Marty Leon is the RTC correspondent for the Patriot and Ivy Leagues.

Predicted Order of Finish:

  1. Cornell  (20 – 9)  (12-2)
  2. Penn   (19-9)   (10-4)
  3. Harvard   (12-16)   (8-6)
  4. Brown   (13-15)   (7-7)
  5. Yale   (13-16)   (7-7)
  6. Dartmouth   (14-13)   (6-8)
  7. Princeton   (13-14)    (4-10)
  8. Columbia   (6-22)   (2-12)

What You Need to Know (WYN2K).  In the conference of the true student-athlete, Cornell looks to be the heavy favorite after a 14-0 league record last season.  They posess a huge home court advantage, playing their  games in snowy Ithaca and return the league’s player of the year in Louis DalePenn will be nipping at their heels trying to regain their championship form,  while Harvard, with the best freshmen crop in the league, looks to be third best.  Beyond that, a logjam ensues where anyone can beat anyone on a given night.  Dartmouth has a possible player of the year in Alex Barnett and Zach Rosen out of Penn should be the best rookie. 

Predicted Champion.  Cornell (#15 NCAA) should come away with the title, as they have all the pieces to the puzzle.  Besides Dale, Ryan Whitman is one of the country’s best 3-point shooters, and 7 footer Jeff Forte provides huge frontcourt presence.  Cornell will be a #15 seed at best, as they were pounded by Stanford 77-53 in the NCAA tournament last year.  Here’s a video of their clinching game against Harvard last year.

Others Considered.  Penn could challenge Cornell as they provide three super sophomores.  Tyler Bernardini returns after a rookie of the year season, while forward Jack Eggleston and point guard Harrison Gaines are back.  Though very talented,  this team will need to rely too much on youth to go the distance.  Harvard falls in the same boat, as Coach Amaker has recruited the Ivy League version of the “fab five.”  We can’t count out Yale and Brown who are also capable of beating these three teams.

Important Games.

  • Penn @ Harvard  (1/31/09)
  • Cornell @ Penn  (2/7/09)
  • Penn @ Cornell  (3/6/09)

RPI Boosters.

  • Penn @ UNC  (11/15/08)
  • Villanova @ Penn (12/2/08)
  • Cornell @ Syracuse  (12/3/08)
  • Cornell @ Minnesota (12/6/08)
  • Cornell @ St. Joseph’s (12/22/08)
  • Harvard @ Boston College (1/7/09)
  • Temple @ Penn (1/14/09)

Neat-O Stats.

1.  Intensity –  Every league game is crucial with no conference tourney to fall back on. 
2.  Scholarships – None given in this league.  All need based financial aid.  Coaches still successfully recruit nationwide.
3.  Family Feud – Yale coach James Jones and Columbia coach Joe Jones are brothers.
4.  Roots – Hall of Fame coaches Al McGuire of Marquette and Dave Gavitt of Providence began their coaching careers at Dartmouth.
5.  Vermont Connection – Brown coach Jesse Agel and assistants TJ Sorrentine and Kyle Cieplicki were all part of the Vermont team that shocked Syracuse in the 2005 NCAA tournament.

65 Team Era.  Since 1985, the Ivy has gone 3-24 (.111) in the NCAA Tournament, with all three of the wins coming within five seasons of each other (1994 – Penn; 1996 & 1998 – Princeton).  The Ivy is now on an ten-year drought without a win in the NCAAs, and eight of those losses have been by double-digits.  Ouch.

Final Thoughts.  If you want to see the purest college basketball, the Ivy League is one of the few places left where true scholar-athletes are on the floor.  On a rare occasion, the league winner makes a decent showing in the NCAA Tournament, but that won’t be the case this season.  No team is athletic enough to compete with the big boys in March.  The real story out of the Ivy this year is second year coach Tommy Amaker’s troubles at Harvard.  After being vindicated of improper recruiting charges, the NY Times ran an article questioning Amaker’s coaching methods after he dismissed several players for no other reason than he passed over them.  The question is, “Is Amaker trying to bring big-time coaching philosophies to a school where winning isn’t the number one priority?”

Share this story

Breaking Down ESPN’s Prestige Rankings

Posted by nvr1983 on August 4th, 2008

Ed. Note:  Don’t like ESPN’s Prestige Rankings?  Provide your comment on how to improve them here.  We’re going to take this information and create a new set of rankings based on additional factors (and getting rid of the moronic NIT appearance = NCAA appearance (1 point) criterion). 

A couple of weeks ago I noticed that ESPN was trying to fill the dead space between the NBA Finals and the Olympics with yet another list. Normally I wouldn’t have even bothered to look at it because ESPN’s lists have been getting progressively more ludicrous (hitting its peak–or nadir–when John Hollinger put Dwayne Wade’s 2006 “Fall down 7 times, shoot 14 free throws” performance above every single one of Michael Jordan’s masterpieces). However, when I noticed that ESPN was trying to rank the most prestigious programs for college basketball in the 64-/65-team era, I was intrigued and figured it was worth some analysis.

Your #1 team of the era

The first thing I always do when looking at any list is to see the scoring system used and ESPN sure picked an interesting system. I’ll break it into segments with some analysis:

• National title … 25
• Title game loss … 20
• National semifinal loss … 15
• Elite Eight loss … 10

– All four of these things seems pretty reasonable. I think that most fans would value the post-season performances in a way that is pretty close to the points awarded although it seems like a Final 4 berth is considered a great accomplishment for any program (even for the Duke’s and North Carolina’s of the college basketball world). I probably would have bumped up the national title, title game loss, and national semifinal loss by 5 points to give a 10 point spread between an Elite 8 loss and a national semifinal loss.

• Best W-L record in conference’s regular season … 5
• 30-plus wins in a season … 5
• Sweet 16 loss … 5

– This is where the scoring starts to get questionable. I’m assuming the “Best W-L record in conference’s regular season” is lawyerspeak for regular season conference champion. I’m glad that ESPN has decided that the America East regular season champion deserves more points for their in-conference performance than the regular season runner-ups in the ACC, Big East, and SEC. The 5 points for the 30-plus win season may seem like a lot, but in fact they are very rare (Duke leads with 9 such seasons and I could only count/remember 16 programs with any 30-win seasons since the start of the 1984-85 season) so that seems reasonable (as does the 5 points for a Sweet 16 loss although 16 programs achieve are awarded this each season while approximately the same number have achieved it for a 30-win season during the entire era). My main question with the 5-point awards is if they really consider all regular season conference titles the same as it is easier to win certain titles than others. One interesting note about this methodology is that Princeton with 10 regular season Ivy League titles is awarded 50 points with this methodology while Duke with 9 30-plus win seasons is only awarded 45 points for that feat (ignoring the fact that Duke probably won the regular season conference title most of those years).

• Conference tournament title … 3
• AP first-team All-American … 3
• Losing in NCAA second round … 3

– I’m assuming that the Ivy League regular season champ automatically gets the 3 points for winning the conference tournament title since they don’t have a post-season tournament. This only further skews the points Princeton and UPenn get in this system as they receive 80 points and 96 points respectively for their Ivy League titles not to mention the 20-win seasons they racked up beating up on Cornell, Columbia, Harvard, and Brown. I’m perfectly fine with the AP 1st-team AA points as at most 5 teams a year will have a player earn that distinction. Perhaps they should have thrown in a National POY bonus as that player is the one who usually defines the season (Ralph Sampson, Christian Laettner, etc.). Likewise, I’m in agreement with the 3 points for the 2nd round NCAA tournament loss.

• Player in top 10 of NBA draft … 2
• NCAA first-round win as a 12-16 seed … 2
• NIT title … 2
• AP second-team All-American … 2

– This is where it starts to get really weird. Let’s get the reasonable things out of the way first. Top 10 pick worth 2 points? Ok. That seems fine even if the draft was dominated by high schoolers and Euros for a few years. In the future, the one-and-done rule might make this benefit the schools that are willing to take the one-and-done guys even if it does hurt their APR. That is unless those guys start going to Europe. Cinderella getting 2 points for a 1st-round upset? Fine with this too even if we will all remember the Hampton upset of Iowa State more than we will remember the annual 5-12 upsets. AP second-team AA worth 2 points? Ok with this one too even if I think once you start getting to the 2nd team the players selected start getting more dependent on the voters. I’m too lazy to check this out (perhaps rtmsf can do it), but I’d be willing to venture there is a lot more variation in the guys selected to the 2nd team by various publications/groups than there is with the 1st team. Now for the crazy one. . .Awarding 2 points for a NIT title? Maybe in the 1950s, but today winning the NIT only makes you the butt-end of every more successful team in your conference. How many message board threads have trolls made mocking the 65th (now 66th) best team in country? I’ll admit that the NIT champs would probably beat the 13-16 seeds most of the time, but is there really any pride in being the small fish (mediocre team) in the big ponds (power conference) that can beat up on the plankton (13-16 seeds)? I’d give the NIT champ 1 point overall, which leads into the next big problem. . .

• 20-29 wins in a season … 1
• NCAA tournament berth … 1
• Postseason NIT berth … 1
• AP third-team All-American … 1

– Let’s get the easy ones out of the way. No problems here with the 20-29 wins or AP 3rd team AA getting 1 point. I would probably differentiate between 20-24 wins, which is usually a solid season, and 25-29 wins, which usually will put you into consideration for a top 4 seed if you’re from a power conference. Like I said before the further down the AA list you go, the more variation you will have by publication/group, but it’s not really worth arguing about for 1 point. The thing worth arguing about is giving the same number of points for a NCAA tournament berth and a postseason NIT berth. To borrow an over-used phrase from John McEnroe, “You cannot be serious!” While I recognize that in this system the NIT team can only receive 2 points from the tournament (if they win), it is ridiculous to even consider invitations to the 2 tournament similar when the entire selection special is based on camera crews camping out in rooms with bubble teams to see if they got into the NCAA tournament. Maybe the ESPN stat whizzes have access to different camera feeds than I do, but it seems like the players, coaches, and families are happier when they get into the NCAA tournament than when they find out they are going to the NIT (even if Madison Square Garden is a slight upgrade from Boise, Idaho–unless we’re talking NBA). That’s just one man’s interpretation of the reactions I see although I could probably point out that a few years ago Georgetown declined an invitation to the NIT because they wanted to give their players more time to study for exams. . .in March. I wonder why Georgetown didn’t turn down its #2 seed this year. Do John Thompson III and the Georgetown AD not care about those same exams any more?

• NCAA first-round loss to a 12-16 seed … -2
• Losing season … -3
• Ban from NCAA tournament … -3

– No problem with the first two although I wonder if a losing season is counted against you if you have it expunged from your record and throw your long-time assistant coach under the bus? Also, I’d consider a 15-16 season a disappointment while I would consider 8-20 a complete embarrassment, so I’d probably make the less than 10-win season a significantly bigger penalty. I think the NCAA tournament ban should be a much larger penalty in this scoring system as the public (and press) reaction tends to be pretty bad (see below).

This is only a 3 point deduction per year?

>> Minimum 15 seasons in Division I
** Ties are broken by overall winning percentage since the 1984-85 season

– After all the issues with the scoring system, I’m not going to complain about these minor qualifiers and tiebreakers. Both of them seem reasonable and none of the top 50 teams were tied.

Now that we’ve looked the methodology it’s time to pick apart the rankings to see what ESPN got right and what they screwed up. Duke is the run-away winner as even the most ardent Duke-hater (feel free to chime in here rtmsf) would agree that Coach K’s Blue Devils have been the most dominant program of the era even if their results have been underwhelming the past few years. The Blue Devils are followed by the Jayhawks in 2nd and the Tar Heels in 3rd. I’m not going to argue much with this although I would have UNC in 2nd just because I consider Kansas a team that historically underperforms in the tournament (Mario Chalmers’ shot and Danny and the Miracles not withstanding). Now onto the rankings I am utterly confused by.

Overated:
UNLV: 8th?!? I loved Jerry Tarkanian’s Runnin’ Rebs, who may have been one of the best college teams ever even if they lost/threw the 1991 national semifinal against Duke, but there is no way this has been the 8th most prestigious program in the country over the past 20+ years just like Memphis isn’t in that category. ESPN provides a pretty clear summary of why UNLV shouldn’t be in the top 10: “2 NCAA sanctions; 10 coaches since 1984-85; 0 NCAA tourney wins between 1992 and 2007”. I’d keep UNLV in the top 20, but they definitely don’t belong in the top 10 with that track record.
Xavier: The Muskeeters (at #17) have a nice Atlantic-10 program, but the fact that they have never made a Final 4 should automatically keep them out of the top 25. The Musketeers are buoyed by 21 combined conference titles, but have not really been a threat in the NCAA tournament having only racked up 15 NCAA tournament wins. Interestingly, Xavier came in 2 spots ahead of Cincinnati even though Xavier is widely considered the red-headed stepchild in the city.
Temple: I don’t mean to sound like Billy Packer ripping on the mid-majors (sorry, if you’re not a BCS conference, you’re a mid-major in my eyes), but the Owls never made the Final 4 despite five trips there under John Chaney. I think they’re a very good program, but like Xavier, Temple shouldn’t be in the Top 25 without a Final 4 appearance.
Murray State: Now this is the point where I rip the little guy. I was absolutely stunned when I saw this one. The Racers always seem to be one of those teams you see at the bottom of the bracket and maybe every once in a while you decide to take a chance on them to pull off the huge upset. Unfortunately, if you’re one of those people, you’ve only been rewarded once (1988 against 3rd-seeded NC State). The Racers piled up the points by dominating the Ohio Valley Conference racking up 22 (or 24 depending on your addition skills) conference titles and twelve 20+ win seasons (thanks to an easy conference schedule). Somehow this manages to put them above Villanova, Oklahoma State, Georgia Tech, and Wake Forest.

Underrated:
Maryland: The Terps (28th) are killed by the fact that they play in the ACC and have lost out on a ton of points thanks to playing in the same conference as Duke and UNC. Although Gary Williams hasn’t had good teams the past few years, the Terps run especially in the Juan Dixon era should have been enough to propel them into the top 20. How does this program only rank 2 spots ahead of Murray State?
Utah: I don’t think the Utes would be able to move up much higher, but it would be interesting to see how high they would be on this list if they didn’t have the misfortune of playing Kentucky so many times in the 1990s. While the Utes benefited playing in a softer conference than some of their peers on the list (SEC and ACC), the Mountain West has been a fairly strong conference in recent years.
Florida: I’m not sure how much higher the Gators could move up because of their relative lack of success (not counting Lon Kruger’s 1994 Final 4 run) before Joakim Noah and company ran off back-to-back titles, but it seems like that alone should be enough to crack the top 20 especially when programs like Xavier and Temple are ranked ahead of them despite not making a single Final 4 appearance. The Gators probably belong in the top 15 although that may be more of a recency effect, but it just seems that there recent run puts them at a level that isn’t that much different than UNLV with its run with Larry Johnson.

Other points of interest:
– Coach K’s current program (Duke) ranks #1. The program he left (Army) comes in tied for 298th, or as it is more commonly referred to “DFL”. Hopefully the Duke athletic department program has a better succession plan in place than Army did when Coach K decides to leave the sidelines.
– I found this rather amusing from personal experience. Boston University comes in at 108th ahead of programs such as Clemson, Providence (with a Final 4 appearance), Washington, and USC.
– In the current SportsNation voting, Kentucky is in the lead (good work out of the Sea of Blue crowd) with Duke in 4th even though they have the most #1 votes (something tells me they were left off a lot of ballots or voted 25th). The three teams I singled out as being overrated in the top 25 were moved down quite a bit. Note: I thought they were overrated even before I saw the online voting.

No bonus points for Dream Teamers?
Share this story

Conference Primers: #22 – Ivy

Posted by rtmsf on October 22nd, 2007

Season Preview Banner 3

Predicted Order of Finish:

  1. Penn (20-10) (11-3)
  2. Yale (17-11) (10-4)
  3. Cornell (17-10) (9-5)
  4. Columbia (14-14) (7-7)
  5. Brown (15-13) (7-7)
  6. Harvard (10-19) (5-9)
  7. Princeton (9-18) (4-10)
  8. Dartmouth (6-19) (3-11)

WYN2K. For possibly the first time in two decades, the Ivy League basketball championship is wide open. The twin towers of power – Penn and Princeton – have held the Ivy title on one of their campuses each of the last twenty seasons. This year, however, Princeton will be recovering from the Joe Scott disaster (18-24 in three seasons culminating in an atrocious 2-12 debacle last year), while Penn will have to deal with the loss of the core group that won three straight Ivy championships. Penn has enough returning to make another run at the title, but don’t expect another 13-1 blitzkrieg through the league, as several other contenders will make their own push toward an NCAA bid.

Predicted Champion. Penn (#14 seed NCAA). Ok, ok, so we’re too chicken to pick anybody else here. We know that on paper there are other Ivy schools with more returning talent (ahem, Yale), but consider the weight of history that Penn has behind it – 5 of the last 6 titles… 7 of the last 9… 10 of the last 15. Every other champion during that time was Princeton. With the Tigers almost completely out of the picture, how can we not make our pick for Penn? Despite losing two-time Ivy POY Ibrahim Jabber and Mark Zoller, the Quakers still have the most depth of any team in the league to go along with the best home court advantage at the Palestra. This year’s squad will be led by Brian Grandieri and Justin Reilly, the latter of whom showed some decent post skills during the NCAA Tourney loss to Texas A&M last year. Sorry, Ivy faithful, but we just can’t pick against Penn until someone outside of Princeton knocks them off their perch.

Others Considered. Should Penn crash and burn this year, Princeton assuredly will not be the beneficiary, which means that a team not used to winning this title will be doing so for the first time in a generation. We like Yale as next in line. The Bulldogs return four starters plus their top two reserves, including prohibitive POY favorite Eric Flato, a do-it-all guard who nailed 71 treys last season. The only reason to lend a skeptic’s glance toward Yale is their maddening tendency to lose “shoulda” games, such as when they dropped a home game vs. Columbia immediately prior to a big showdown at Penn last year, effectively ending their conference title hopes. Cornell is another team that appears ready to make the leap on paper, but simply hasn’t been able to get past the monolith in Philly. Coach Steve Donahue is a tidy 0-14 in his career vs. the Quakers, which doesn’t exactly inspire confidence in winning a conference race that depends solely on regular season performance. Still, the Big Red, who was the last non-P&P team to make the NCAA Tourney back in 1988, has a nice set of guards returning (Ryan Wittman and Louis Dale) along with the 2006 ROY Adam Gore (redshirted last year) and USC transfer Collin Robinson.

Games to Watch. Since the Ivy League decides its champion via round-robin and not a conference tournament, there are a few key home-and-homes to watch this season.

  • Cornell @ Yale (02.02.08) & Yale @ Cornell (02.22.08)
  • Yale @ Penn (02.16.08) & Penn @ Yale (02.29.08)
  • Penn @ Cornell (02.09.08) & Cornell @ Penn (03.07.08)

RPI Booster Games. Last year the Ivy League went 2-17 against BCS schools, but surprisingly, middle-of-the-packers Cornell (defeated Northwestern 64-61) and Brown (defeated Providence 51-41) were the two winners. Penn, on the other hand, was 0-5 – go figure. There are 23 games on the slate this year, and here are a few highlights.

  • Yale @ Stanford (11.20.07)
  • Virginia @ Penn (11.23.07)
  • Brown @ Northwestern (11.24.07)
  • Michigan @ Harvard (12.01.07)
  • Cornell @ Syracuse (12.20.07)
  • Penn @ Miami (FL) (01.02.08)

Odds of Multiple NCAA Bids. Zippo.

Neat-o Stat. With the hiring of Tommy Amaker at Harvard and Sydney Johnson at Princeton, six of the eight head coaches in the Ivy League are now black. Unthinkable a generation ago, this means that the Ivy has a higher percentage of black head honchos (75%) than all but the two historically black D1 conferences, the SWAC and MEAC. We’re not sure if that will necessarily translate to more wins at those two schools, but it can’t be a bad thing in terms of inspring qualified minority hiring practices at other schools (ed. note – we guess that assumes Amaker is qualified. Apologies).

64/65-Team Era. The Ivy League has gone 3-23 (.115) over the era, with all three wins concentrated in the mid- to late-90s. The Ivy tends to receive a favorable seed from the NCAA committee, averaging a #12.8 over this period, which equates to an expected value of around seven wins. This shows that the league has really underperformed compared with its seed over the years. Of the three wins, two belong to Princeton (1996 – #13 Princeton 43, #4 UCLA 41; 1998 – #5 Princeton 69, #12 UNLV 57) and one to Penn (1994 – #11 Penn 90, #6 Nebraska 80). With that said, the league’s NCAA representative (well, Penn, really) has in recent years consistently played its first round opponent tough before ultimately succumbing to superior talent.

  • 2003 – #11 Penn down four to #6 Oklahoma St. with 2:25 remaining
  • 2006 – #15 Penn down one to #2 Texas with 6 mins left
  • 2007 – #14 Penn tied with #3 Texas A&M with 11 minutes to go

Nothing says thrilling like Gus Johnson, so we’ll leave you his call of 1996 Princeton-UCLA.

Final Thought. We actually look at this year’s Ivy a little bit like we look at the Big South. You have one program (Penn and Winthrop, respectively) that has clearly been the class of the league for the better part of a decade going through some serious changes, and you have a smattering of challengers ready to stake their claims on the league crown. The problem in both cases is more psychological than physical – can the likes of Yale and Cornell overcome the mental hurdles that Penn has constructed for them over the years by winning a key game in late February on the road when it really counts? It should make for an interesting winter in our nation’s smartest league, that’s for sure.

Share this story

It Happens More Than We Think

Posted by rtmsf on July 25th, 2007

Now that we’ve had a few days to mull over our thoughts with respect to this Tim Donaghy scandal, and after watching the Commish and High Priest of All Things Basketball grin and bear it through an excruciating (for him) press conference yesterday, we still find ourselves circling back to our initial thoughts when the news broke.

It happens more than we think.   

Sports Betting is Cool 

Yes, it’s horrible and it shows a lack of oversight of its refs by the L and it calls into question the very integrity of the game that Stern and his predecessors have worked so hard for so long to  ensure… 

And it raises valid questions about the possibility of other officials involved, other leagues involved, other (gasp) players involved, the plausibility of collusion, whether this is an isolated incident, and what, if anything, the lords of professional and amateur sports can do to contain it or snuff it out completely… 

And yet, the simple answer is that they can’t.

We like to imagine that this kind of thing can only happen in far-flung places in sports far inferior to ours, the kinds of places where officials have one foot on the field and one in the smoky backroom pub scene that gives rise to the incentive in the first place (are we talkin’ about this or are we talkin’ about this??).  The kinds of places where institutional shadiness is the rule for getting anything done.   The kinds of places where judges fix Olympic matches and sporting heroes are eliminated for their on-field transgressions.  After all, we live in the USA –  the land of internal controls and open transparency and due diligence and audit trails and CYA and watchers of the watchers of the watchers, right?  Right?

So how much are your Enron or Worldcom shares worth these days? 

So where are those shifty WMDs located after all?

So when does OJ come up for parole again at San Quentin?  

Sports Bookie  

Does Your Guy Offer Teasers?

This is not to say that we buy into the avalanche of conspiracy theories that were already surrounding the NBA prior to last Friday.  All those chirping Suns fans need to pipe down – Donaghy betting the Over didn’t make your team lose.  However, we also mustn’t keep our heads in the sand here.  Stern told us yesterday and he’s going to preach the mantra again and again that this was an isolated incident of a lone gunman referee.  But doesn’t your gut tell you that, while Donaghy probably acted alone here, there have been others in the past?  Maybe there are others now? 

When we heard that the ACC, attempting to capitalize on the NBA’s bad publicity to tout its own integrity, stated that they spend $135 on a background check of each of its officials, we couldn’t contain our hearty guffaws.  The Big Ten makes an identical claim.  While kudos are in order that these two leagues are doing something to show that its hired hands possess a modicum of integrity, we know for a fact that a simple background check revealing a very basic civil/criminal and credit history gives minimal information with respect to whether someone is a closet gambler or would become compromised to the point of taking money to impact spreads.  How do we know this?  Well, as we were formerly under the employ of a company specializing in “security consulting,” we understand that any deliverable under $1000 each for this type of work will be fraught with gaping holes in coverage and generally suspect as a useful tool – it’s simply not enough.

And what about the 29 other D1 leagues and their officials?  Is anyone doing background checks on these guys?  Is anyone evaluating their calls with the same gusto that the NBA and NFL does (and yet, Donaghy still slipped under the radar until the FBI overheard his name on its mob-related wiretaps).  According to Stern, Donaghy (a 13-year veteran) was making a hefty $260k/year (a first-year NBA official will make $85k).  MLB umpires start at $88k and range up to $300k/year.  As essentially part-timers, NFL referees make between $42k – $121k/year.  What about NCAA refs?  In college basketball, they work as independent contractors and get paid approximately $2000 per game – as an example, Ted Valentine worked 98 games last season, so his annual salary would have been $196k.  In college football, the requirement of more officials equals less pay, averaging around $1100 per game for each.

Referee with Bob Knight   

Is $100k-$200k Enough for NCAA Refs? 

Where there’s a vacuum, there is an incentive.  At the professional level, the officials on the floor/field make at best 10% of the league average of the players.  In college officialdom, the money isn’t as good as their professional peers and the oversight is accordingly weaker.  What this means is that, if done correctly selectively, by keeping it completely to yourself (read: online betting using false credentials and third-party transaction services – hello IRS audit!) or with one trusted associate, and appropriately obfuscating the winnings, it is virtually impossible to determine whether a Mountain West or Sun Belt or Big 12 or SEC official is influencing pointspreads and/or outcomes for personal enrichment.  He could earn several extra thousand dollars per week (not enough to move the Vegas lines) without so much as an eyebrow raised.       

The professional leagues like to claim that this never happens, but we already know that it does.  What about the Black Sox scandal of 1919, Pete Rose, Tim Donaghy and even perhaps the sacred cow of the NFL, who according to investigative writer Dan Moldea, at least seventy games were fixed throughout the 1950s-70s?  At least nowadays we can rest assured that these leagues are on notice for corruption, even if as in the case here with Donaghy, it is not outed earlier.   The NCAA environment, however, is more ripe for corruption of this type, with its witch’s brew of amateur players, not-as-well-compensated officials and an incredible lack of oversight from most leagues.  Can the Pac-10, for example, show how each official calling games in its league did ATS and O/U for the last four years to sniff out evidence of possible corruption?  Doubtful.   

Flamingl LV

Found in John Clougherty’s Pockets!

A recent statistical analysis from the Wharton School at Penn suggests that one percent (~500) of NCAA basketball games from 1989-2005 fell into an outlier that suggests gambling-related pointspread corruption.  This dovetails with a 2003 NCAA report that states that 1.1% of NCAA football players and 0.5% of NCAA basketball players accepted money to play poorly in a game (extrapolating from the sample suggests that this affects ~21 basketball and ~112 football players annually).  Somehow the math isn’t adding up (500 games/17 seasons = ~30 affected games/year in NCAA basketball) – what could possibly account for that difference? 

While we can’t find an example of an NCAA official becoming involved in a pointshaving scandal like what we’ve seen at Boston College, Arizona State and Northwestern in recent years, we have no doubt that it occurs – much like Donaghy until he got busted, they’re probably just better at hiding it.     

Share this story

NCAA Tourney Conference Overachievers and Underachievers (1985-2007)

Posted by rtmsf on July 11th, 2007

Today we’re ready to unleash the last installment of our analysis of NCAA Tournament stats of the 65 (64) team era… that is, unless we decide to analyze the coaches too… well, it is over three months until Midnight Madness, so ok, hold that thought.  Anyway, as you hopefully recall, during the weekend we took a look at the raw numbers of the era by conference, and essentially concluded that the ACC has been the most successful conference of the last 23 years, the Pac-10 SWAC/NEC the worst, and that the mid-major conferences may not have been as consistently good as we had hoped over the years.

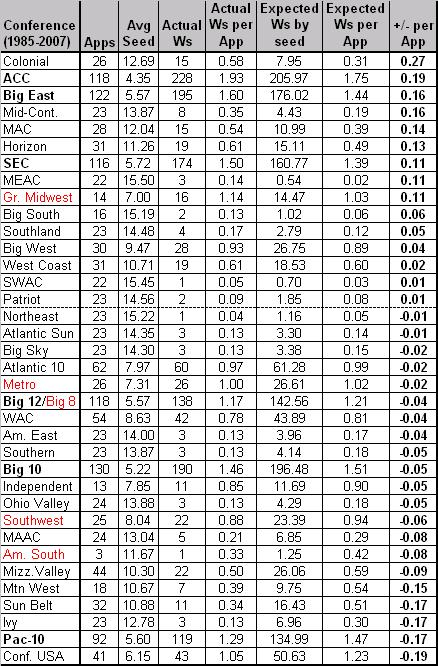
Now let’s take a look at the conferences who have overachieved and underachieved over the 65 (64) team era. In our analysis of this measure by school, you may remember that we looked at two different models – a Standard Model of expected wins by seed (e.g., a #1 seed should win 4 games per appearance), and a Historical Model of expected wins by seed (e.g., a #1 seed has actually won 3.36 games per appearance from 1985-2007). We concluded then that the true value lies in considering the Historical Model foremost because the Standard Model places too unrealistic of an expectation on high seeds and not high enough of one on low seeds, which ultimately skews its results in favor of lower-seeded schools and conferences. Given that condition, we now show the Overachiever and Underachiever conferences of the 65 (64) Team Era using the Historical Model. See Table A below.

Table A. Historical Model applied to 65 (64) Team Era

Notes: the table is sorted by “+/- per App,” which represents the number of games won above or below the expected number of wins for that seed per NCAA appearance (1985-2007). The conferences whose names are in bold are BCS conferences. The conferences whose names are in red are conferences that no longer exist.

NCAA Tourney by Conf v.3

Not Just George Mason. The first thought everyone will have (because we had it too) is that George Mason‘s miraculous run in 2006 accounts for the Colonial Conference’s rather aristocratic pedigree at the top of our list. But looking a little further inside the numbers somewhat mitigates this idea. Sure, the Masonites (as a #12 seed) won 3.52 games beyond its expected value of 0.48 wins per appearance in 2006, but that only accounts for half of the Colonial’s wins beyond expectation during this era. So where are the rest of the wins coming from? Thank David Robinson’s Navy squads of the mid-80s and Dick Tarrant’s Richmond Spiders in the immediate aftermath for the CAA’s perch as the biggest overachiever on our lofty list.

David Robinson

George Mason isn’t the only CAA School to Overachieve

BCStriation. Unlike our previous posting that used standard objective measures (wins, F4s, titles, etc.) to show that the six BCS conferences were without question the top six leagues of the era, today’s posting paints a substantially different picture. A league can be very successful objectively and still considerably underachieve, as in the strange case of the Pac-10 (and to a much lesser extent, the Big 10). Although the Pac-10 was clearly the weakest of the BCS conferences by the raw numbers, we certainly didn’t expect that it would be the second-worst underachiever of the 65 (64) team era – but it unquestionably is. The Pac-10 has won sixteen fewer games than it should have during this period, which dwarfs the negative output of any other conference – next in line for public shaming are Conference USA (7.6 wins fewer) and the Big 10 (6.5). Looking back at our list of chronic underachieving schools, we note that Stanford, Arizona and Cal all fall into the frequent NCAA underachievers list, which should have tipped us off that this was coming.

High Achievers. On the other side of things, the ACC and the Big East fall in line behind the CAA as the biggest overachievers of the era, which proves that you can get great seeds, have tremendous objective success in terms of wins and titles, and still overachieve as a conference. The ACC has won a whopping 22 games and the Big East 18 games beyond expectation; and the SEC isn’t far behind with 13. We also want to nod a tip of the hat to the Mid-Continent (+4.5 wins), MAC (+4 wins) and Horizon (+4 wins) conferences, each of which shows that leagues with consistently low seeds can do some damage on a regular basis in the NCAA Tournament.

Bradley

Missouri Valley Teams Need to Do More of This

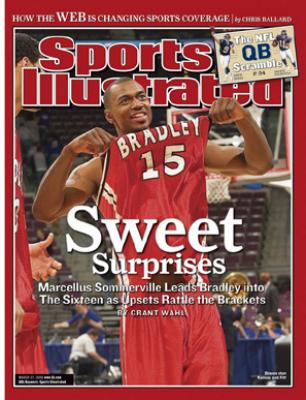
What About…? If anything, these last two posts have opened our eyes to just how traditionally overrated the Missouri Valley Conference has been. For a so-called mid-major who gets multiple teams invited every year, its performance leaves a lot to be desired (4 wins below expectations). We realize that things change – conferences get better and worse over the years – but the MVC is going to have to really start producing in the next 5-10 years to lose our proffered overrated tag. As a comparison, the Horizon and West Coast conferences have performed nearly as well (19 wins each) as the MVC (22 wins) despite earning far fewer NCAA bids and having a slightly worse average seed.

Ivy League Paradox. We suppose that if you asked a hundred college basketball fans whether they believed the Ivy League traditionally overachieves in the NCAA Tournament, 99 of them would likely agree. This is probably due to a memorable upset or two over the years in addition to a common perception that the Ivies are a “tough out” every year. But looking above, we see quite starkly that the Ivy League has been one of the biggest underachievers of this era, earning only three wins versus an expected total of seven. This is largely because the Ivy champs (usually Penn or Princeton) have consistently earned seeds ranging from #11-#13 over the last decade, but haven’t been able to earn a single win during that period. The lesson here, we suppose, is to never take an Ivy team in your brackets (we’ve heard that taking an Ivy team against the spread in the first round is a good bet, however).

Share this story

Top NCAA Performers of the 65 (née 64) Team Era

Posted by rtmsf on June 12th, 2007

GMU Cartoon

Since there’s absolutely nothing going on this week, this is a good a time as any to start rolling out some of the data that we’ve been hoarding. First, a respectful tip of the hat goes to Florida Gator fan Louis Frank, who allowed us unbridled access to the detailed work in his NCAA Tournament database. Over the next week or so, we’re going to be presenting some descriptive statistics on the 64/65 team era of the NCAA Tournament sliced and diced in various ways.

Our first focus will be on individual team performance, viewed through the raw numbers and then with some analytical twists; then we’ll turn our attention to conference performance using the same parameters. The basic question we seek to answer is which teams and conferences tend to over- and underachieve in the NCAA Tournament since it expanded to 64 teams in the 1985 season? The reason we start with that somewhat arbitrary season is because from that point until now every championship team has had to win six games against seeded teams, with no exceptions. It also provides a tidy way of reviewing the data with a substantial sample of seasons – twenty-three – which also happens to coincide perfectly with the rise in popularity of NCAA basketball and the ESPN era.

NCAA Tournament Success (1985-2007)

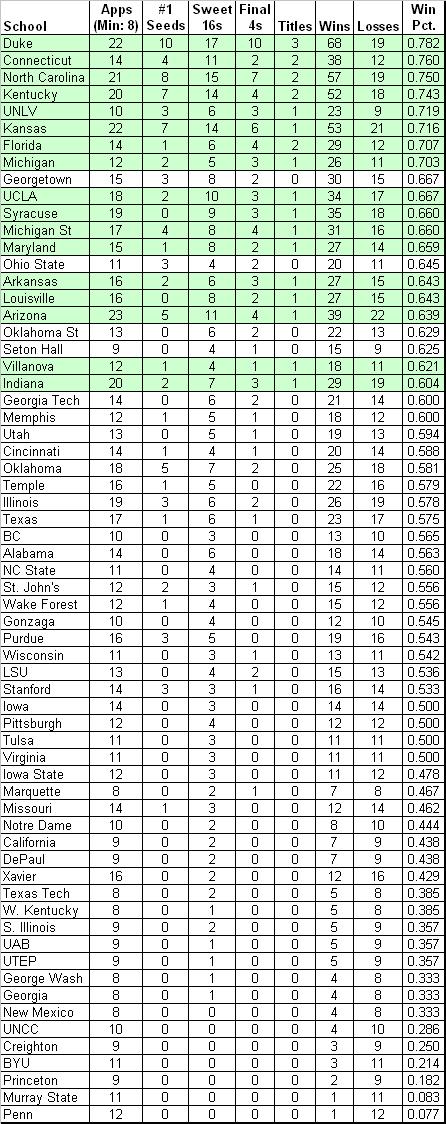
Notes: the chart is sorted by winning percentage (minimum: 8 appearances) from 1985-2007. The green shaded rows represent schools that have won a national title during this period.
NCAA Tournament 1985-2007 v.3

Inside the Numbers:

Elite Eight. Of the 267 schools that have been invited to the NCAA Tournament during the last 23 years, the 64 listed above are the chronic repeat performers, each having made the Dance on at least eight occasions. Thirty-nine of those sixty-four have winning (> .500) records, but only a handful, eight, are elite (> .700 winning pct.). Suffice it to say that those eight elite programs account for 14 of the 23 (61%) national championships and 39 of the 92 (42%) Final Four teams during this era (programs with a national title are denoted above in green shading). These eight programs are: Duke, Connecticut, UNC, Kentucky, UNLV, Kansas, Florida and Michigan. Incidentally, Georgetown is the only school of the top 13 who did not have a title from 85-07, but dumb luck led to its 1984 title team being omitted from this list – apologies to the Hoyas.

Coach K b/w

You Have to Give the Devil His Due

The Krzyzewski Era. This era also neatly coincides with the rise of Duke as a basketball powerhouse – Coach K’s first Final Four was in 1986, and his string of success particularly from 1988-92 exceeds by itself almost every other school’s performance on this list. Duke has the most #1 seeds, the most Sweet 16 appearances, the most Final Four appearances, the most wins, the best winning percentage and the most national titles during this period. In several of those categories it leads by comfortable margins. We’ve made note that the current era of Duke basketball might be slipping a tad, but with numbers like the above to sustain, that may be an impossible task even for Krzyzewski. By these numbers, you’d have to go with North Carolina in second place and Kentucky a close third. Each has very similar statistics (appearances, #1 seeds, sweet 16s, titles, wins, winning pct.) in all but one category, Final Fours. Given the importance that the college basketball community places on reaching the final weekend, Carolina’s seven F4s to Kentucky’s four must trump, all else being relatively equal.

Traditional Powers. With Duke, UNC and Kentucky taking the top three spots by the raw numbers, how do the other three traditional powers of UCLA, Kansas and Indiana fare? Kansas is closest to the top group. The Jayhawks mirror UNC in many categories (including F4s), but its winning percentage is a little lower and it lacks that second national title that would vault it into the top three. UCLA experienced a couple of down periods during this era, but now appears to be on the rise again with two F4s in the past two seasons. Still, its top ten winning percentage (.667) and its national title in 1995 keep it in the second tier of performers over this era. Indiana has largely struggled since Bob Knight was forced out of Bloomington, but their consistency in making the tournament and winning a game or two (.604 winning pct.) – plus that national title in 1987 – probably keeps it in the second tier as well. There should be no question, though – if any of the traditional six powers were slipping in favor of one or more of the nouveaux riche, Indiana would be the choice here.

Bob Knight IU

IU is Showing post-Knight Slippage

Nouveaux Riche. Of the elites, Connecticut and Florida are clearly the party-crashers. Prior to 1985, UConn had four wins and Florida zero wins in the NCAA Tournament. Each now has two national titles and a winning percentage of greater than .700. The question is whether these programs will be sustainable whenever Calhoun and Donovan decide to move on (Calhoun, to retirement; Donovan, as Christine’s full-time house-b*tch). The 64/65 team era is already littered with similar riches-to-rags stories such as UNLV, which fell hard when Tarkanian was indicted retired; and, Michigan, who also dropped out of the college basketball landscape once the gravy train of athlete peddler Ed Martin ended. Arkansas is yet another example – all three programs have a national title and multiple F4s to its credit, but long periods of poor teams and inconsistency places them in the second tier of the era.

Others in Second Tier. Several programs were consistenty excellent over this era, but their numbers weren’t as eye-popping as some of the above schools. Syracuse, Michigan State, Maryland and Louisville all claim a title to go with multiple F4s. Who knew other than Orange fans that Jim Boeheim’s squad never claimed a #1 seed during this era – that seems hard to believe. True, though – Syracuse’s best seeds were five #2s – during the glory days of Pearl Washington, DC, Billy Owens and company – 1986, 1987, 1989, 1990, and 1991. It looked like Michigan State was ready to become a top tier program 6-8 years ago, and they still are an excellent one, but its winning percentage needs to improve a little more to reach that level.

Lute Olson

The Silver Fox has had his Ups and Downs

Whither Arizona? Arizona is the only school that was invited to the NCAA Tournament each year of this era. Yet Arizona’s success in the postseason leaves something to be desired for a program of its stature – multiple F4s and a title, but near the bottom of the championship-level schools in winning percentage. The Wildcats are a team to keep a watchful eye on when we present our over- and under-acheivers list later this week.

Rising Stars. Several programs to observe closely as we go deeper into this era are rising stars Georgetown, Ohio St., Memphis, Texas and Gonzaga. None yet has a title during this era, but each except Gonzaga has been to a F4, and all five are knocking on the door. These programs have the facilities and coaching in place to continue to rise up this list in the coming years.

Disappointments. Again, basing these observations on nothing more than raw numbers, you’d have to say that Oklahoma, Illinois, Purdue and Stanford have been the biggest disappointments. Collectively, these schools have had fourteen #1 seeds with only five F4s to show for it (obviously, zero titles as well). Although most of these programs have been consistently invited to the NCAA Tournament during this era, none has a winning percentage topping .600.

Quin Snyder Norm Stewart

What did these two do to Missouri?

Embarrassments. We’ll leave the mid-majors like Xavier alone here, but we wanted to save special mention for some of the BCS schools who have managed to get invited multiple times, but really didn’t do much when they got there. Georgia‘s one sweet sixteen in eight appearances and its .333 winning percentage doesn’t say much for a program that always seems to be rebuilding; Bob Knight’s Texas Tech doesn’t fare much better (two sweet sixteens). But the real winner of the most pathetic NCAA-caliber program award, in our estimation, has to belong to Missouri. The Tigers have been to the tournament fourteen different times during this era, even once as a #1 seed, and have only managed three sweet sixteen appearances, two elite eights and an overall losing record (.462). Serious congrats are in order for Norm Stewart and Quin Snyder. Mike Anderson has his work cut out for him. The saddest part is that Mizzou traditionally likens itself as a basketball school!

Ivy Sadness. The last word goes to Ivy stalwarts Penn and Princeton, two schools who show up every year (21 of the last 23 NCAA Tournaments) at the right time and venue, battle hard for about thirty minutes against a superior athletic opponent, then go back home and lick their wounds for another year after inevitably wearing down to the size and strength of its opponent. They may be a collective 3-21 (.125) in the Dance, but who will forget when they pull the big upsets, like Princeton 43, UCLA 41 (1996), or Penn 90, Nebraska 80 (1994). Ok, maybe beating Nebraska isn’t a big upset after all, but we still love the UCLA upset.

Coming Next: now that we’ve analyzed the raw numbers of the 64/65 team era of the NCAA Tournament, we’ll next be taking a look at the over- and under-achievers during the same period. After seeing the above, can you project who the best and worst will be? You might be surprised at some of the results.  View Overachievers and Underachievers here.

Share this story