Memphis Chasing History?

Posted by rtmsf on April 7th, 2008

If you’ve read this blog before, you know that we have an affinity for historical context when it comes to college basketball.  We like to think about how teams and players match up statistically in the NCAA Tournament given the parameters of greatness already set by precedent.  For example, much has been already written about this year’s F4 perhaps being the strongest of all-time, illustrated by the combined 143-9 record coming into last weekend and the four #1 seeds.  We love that stuff. 

To that end, we could be on the verge of another historic college basketball event the likes of which we haven’t seen for a generation.  Memphis currently sits at 38-1, which already gives the Tigers the record for most wins in a season, but if they win their 39th tonight versus Kansas they’ll be able to make a claim of greatness that only one team has been able to make since the UCLA run ended in 1975 – with a victory, they will become the first one-loss team in the post-UCLA era to win a championship.  Only the 1976 Indiana team (32-0) would surpass the final record that Memphis is contemplating tonight.

Memphis players Joey Dorsey (32), Andre Allen (15) and Kareen Cooper (42) celebrate with teammates during the closing minutes of a victory against Rice. The Tigers players live together in two adjacent houses and also work and eat with each other.  

Memphis Tigers – All Time Great Team?

Now, why does this matter?  We think it is important because a 39-1 record would squarely place 2007-08 Memphis into the argument of one of the greatest teams of the post-UCLA era.  This is especially true given the caliber of opponent that they have beaten in the last three rounds (#5 Michigan St., #2 Texas, #1 UCLA) and how they have beaten them.  A 50-20 halftime score against Michigan St.; a clamping down of Texas and DJ Augustin in their home state; and rendering the vaunted UCLA defense completely ineffective on Saturday.  Additionally, Memphis’ scoring margin of +18.6 this season would rank it #2 in the last ten years of champions (Duke 2001: +20.2), so this team is all kinds of legit in historical terms.     

It’s also interesting to consider that outside of the unbeaten 1976 Indiana team, no other team in the modern era has managed to win a title with less than 2 losses!  Here are the results for the group of teams with zero or one loss entering the Tourney.

1977 – San Francisco (29-1) – lost first round to UNLV
1979 – Indiana St. (33-0) – lost title game to Michigan St.
1988 – Temple (29-1) – lost regional finals to Duke
1990 – Lasalle (29-1) – lost second round to Clemson
1991 – UNLV (34-0) – lost semifinals to Duke
1996 – UMass (35-1) – lost semifinals to Kentucky
1997 – Kansas (32-1) – lost regional semifinals to Arizona
1999 – Duke (37-1) – lost title game to UConn
2004 – St. Joseph’s (27-1) – lost regional final to Oklahoma St.
2005 – Illinois (37-1) – lost title game to UNC
2008 – Memphis (38-1) – ???????

Without question, Indiana St., UNLV, UMass, Kansas, Duke and Illinois were on the verge of greatness had they won the national championship.  We think Memphis is on that same plane.  While it’s true that CUSA sucks and doesn’t provide much in the way of competition for the Tigers during the regular season, Memphis challenged itself this year with nine OOC games against NCAA Tournament teams, including UConn, Arizona, Gonzaga and Tennessee.  They certainly have the talent to be in the argument with many of those other one-loss teams, and their performance to date (despite all the naysayers, ourselves included) substantiates its inclusion among the pantheon of great teams should they pull it off tonight. 

Share this story

Thursday, March 20th: Update #2

Posted by nvr1983 on March 20th, 2008

We missed the 2nd half of the first set of games while we were being tortured by a massage therapist so these recaps will be brief.

Final Scores
#1 Kansas 85, #16 Portland State 61:On the bright side for Portland State, they played Kansas close in the 2nd half. Unfortunately, the Jayhawks already had won the game in the first 10 minutes.

#3 Xavier 73, #14 Georgia 61: I’d like to thank Xavier for turning it around and saving my perfect bracket. Maybe Georgia should have scheduled another game earlier in the day.

#5 Michigan State 72, #12 Temple 61:The Spartans survive an awful game from Drew Neitzel (2/11 FG) thanks to an even worse game from Dionte Christmas (1/12 FG). Raymar Morgan wasn’t bad either with 15 pts on 7/9 FG.

Ongoing
#6 Marquette 56, #11 UK 51: The only reason Kentucky is still in this game is because of a huge game from Joe Crawford (28 pts with 7:43 left).

#4 Pittsburgh 47, #13 Oral Roberts 24: The Panthers are cruising as they are almost doubling up their overmatched opponents.

#6 Purdue 48, #11 Baylor 27: The young Boilermakers look like they have this game in control.

#8 UNLV 51, #9 Kent State 30: It looks like the Vegas books led me astray and cost me my perfect bracket.

Share this story

Thursday, March 20th: Update #1

Posted by nvr1983 on March 20th, 2008

It’s halftime of the early games so I guess it’s time for an update.

#14 Georgia 35, #3 Xavier 26: Get ready to tear up your brackets unless you are from Athens, GA.

#1 Kansas 49, #16 Portland State 26: It looks like Bill Self’s team will avoid a first-round choke again this year.

#5 Michigan State 35, #12 Temple 26: Tom Izzo’s Spartans are in good shape and look to avoid the traditional 5-12 upset.

It’s interesting that two scores have the same score and all 3 teams trailing have scored the same number of points. Obviously, Portland State has the small problem that Kansas already has 49, which we are not sure Portland State will get to after 40 minutes.

Share this story

South Regional Analysis

Posted by nvr1983 on March 19th, 2008

This is our final regional analysis and we’re running short on time to get them in before your brackets are due. Consequently, our analysis of the lower seeds will be very brief.

Teams
#1 Memphis:We can’t remember a #1 seed that has gotten less hype as a potential nation champ or more criticism. We know the Tigers aren’t going to remind anybody of a J.J. Redick shooting video. We know that they play in a relatively weak conference. We also know that they are 33-1 and were a short jumper away from being undefeated. We also know they may be the most talented team in the country. What does this all mean? We have no idea if the Tigers will win the title, but we do know that nobody wants to face Derrick Rose and Chris Douglas-Roberts. They have an easy path to the Sweet 16 where they could face a very difficult challenge in Pitt. Schedule/Roster.

#2 Texas:In their first year AD (After Durant), Rick Barnes brings the Longhorns back to the tournament with a much better team even if certain LA residents who like to claim allegiance to Boston sports teams without suffering through the winter don’t care about them (or college basketball) any more. These Longhorns are led by All-American candidate D.J. Augustin (19.8 PPG and 5.7 APG) who brings a strong supporting cast with him to the NCAA tournament. Although they are the #2 seed, some might argue they are the favorites in the region thanks to the committee’s ridiculous decision to give them homecourt in the regional finals. That and the fact that they already have been UCLA and Tennessee this season. If they meet Memphis in Houston, the NBA scouts will definitely be watching for the great PG matchup (Rose vs. Augustin). Schedule/Roster

#3 Stanford: We actually have quite seen quite a few Cardinal games this year thanks to FSN. With Brook Lopez clearing that little issue of going to class, Stanford has become a very good team. Despite playing West #1 seed UCLA close two times in the past 2 weeks, we don’t think Lopez has the support to get Stanford by either the Longhorns (in Houston) or Memphis (anywhere other than Palo Alto) to make it to the Final 4. Schedule/Roster

#4 Pittsburgh:Jamie Dixon’s Panthers have done a great job overcoming injuries since their early-season win over Duke in Madison Square Garden. The Panthers tend to dominate inside with Sam Young and DeJuan Blair, but are yet another good team that struggles at the FT lines (22/44 in the Big East final). While we normally would look at their Big East title as a sign they are ready to make a deep run in the tournament, Pitt has a history of doing well in their conference tourney and failing to reach the Final 4. When we combine that with the fact that their physical style is subject to the tight NCAA tournament officiating (h/t to Jay Bilas), we are unsure about their chances to make it to San Antonio. However, we look forward to seeing Levance Fields against Derrick Rose (and possibly D.J. Augustin) in Houston. Schedule/Roster

#5 Michigan State:It seems like Drew Neitzel has been a Spartan forever. He has grown from a talented if inconsistent player into Tom Izzo’s go-to guy. While he will have difficulty creating against more physical guards, Neitzel finds a way to get it done. If MSU can get there, it should be a very interesting matchup with Pitt in the Sweet 16. If they are to get past the Sweet 16, Neitzel will need a lot of help from Raymar Morgan. Schedule/Roster

#6 Marquette:The Golden Eagles are led by Jerel McNeal, who has overtaken his more hyped teammate Dominic James as the team’s most vital player. While Marquette is not as good as advertised early in the season, but they should be good enough to get by Kentucky, which is a rematch of the 2003 Elite 8 matchup where Dwayne Wade’s triple-double knocked out the last great Wildcat team. Schedule/Roster

#7 Miami (FL): After a torrid 12-0 start (helped by a cupcake schedule), the Hurricanes cooled off in the middle of the season before getting into the Big Dance with some big late season wins most notably over Duke. Miami will be challenged right off the bat by St. Mary’s. To be honest, their potential 2nd round matchup may be easier than playing St. Mary’s despite what the seeds say. Schedule/Roster

#8 Mississippi State: The Bulldogs were able to survive the falling Georgia Dome, but they were unable to withstand their buzzsaw namesakes from Athens, Georgia. MSU is led offensively by Jamont Gordon and Charles Rhodes and defensively by the human eraser known as Jarvis Varnado. We think they should be able to get by Oregon before meeting a tougher challenge in the 2nd round. Schedule/Roster

#9 Oregon: Perhaps no team has received more criticism for their seed than the Ducks. They made the tournament by winning their last 3 regular season conference games, but we question their ability to make a serious run as they lost every game down the stretch to the top Pac-10 teams including the ones at the vaunted McArthur Court. Schedule/Roster

#10 Saint Mary’s: The Gaels, led by Patrick Mills and Diamon Simpson, are a quick, athletic team that sports wins over Oregon and Gonzaga. However, they struggle with more physical teams that slow the tempo down. This may not matter as they probably won’t play a slow-paced team before they are knocked out. Schedule/Roster

#11 Kentucky: Billy Gillispie has done an outstanding job salvaging this season, which started out so poorly with a loss at home to Gardner-Webb in the 2nd game of the Wildcat season. This is a pretty mediocre Kentucky team especially with the loss of their best player Patrick Paterson to injury. However, Gillispie has molded the team’s style (slow the game down and limit possessions) to maximize what he has. Kentucky isn’t nearly good enough to make a run in the tournament, but they might be able to pull of an upset or two. Schedule/Roster

#12 Temple: The Owls come in having won the Atlantic 10 tournament title, which sends a pretty strong signal that they are playing well late in the season. When you watch, Temple you will realize these aren’t Don Chaney’s Owls. Instead of relying on their physicality, these Owls are very explosive led by Dionte Christmas (20.2 PPG and 6.0 RPG) and Mark Tyndale (15.9 PPG, 7.2 RPG and 4.3 APG). They should provide the Spartans with a stiff challenge in the first round. Schedule/Roster

#13 Oral Roberts: While Oral Roberts is led by 5’9″ guard Robert Jarvis, their hallmark is their relentless defense. Unfortunately for them, they will be facing what is potentially the most physical team in the tournament in the first round. Schedule/Roster

#14 Cornell: The Ivy League champs usually can at least taunt opposing fans that they will usually be the boss of the fans of the team that is kicking their ass. Unforunately for Cornell and their fans, they play Stanford so they don’t even have that to hang their hat on this year. Schedule/Roster

#15 Austin Peay: They have absolutely no shot against a talented and tough Longhorn team. Schedule/Roster

#16 Texas-Arlington: We give them 5 minutes before their game against Memphis gets out of hand. Just way too much athleticism on Memphis’s side. Texans may get some form of revenge in the regional finals. Schedule/Roster

Share this story

ATB: It’s Baaaaaackk….

Posted by rtmsf on November 10th, 2007

ATB v.4

11.09.07

Story of the Night. 93 Games. 186 teams. Thank God college hoops is back, baby. We’re a little late, but this is why we care. We got to watch pieces of six games tonight, and while the games looked like Nov. 9, meaning sloppy, it was soooo refreshing to see and hear the sneakers squeaking on the hardwood again.

Things We Saw. Kansas is so loaded we can’t understand how they lose to anyone. Darnell Jackson (21/4/4 stls) off the bench, Sherron Collins (22/6 asts/4 stls), and so much more. UL-Monroe isn’t that bad either, but they were really never in the game (Kansas 107, UL-Monroe 78). In Florida, the Gators are (as expected) extremely young but talented – their freshmen scored 46 of their 75 pts and Nick Calathes looked great, leading the team with 21 pts. They were never threatened with an L by North Dakota St., but they could never really put them away either. That will likely come with experience (Florida 75, North Dakota St. 65). Staying in the SEC, Tennessee took a while to get going against Temple, and they didn’t shoot well from 3 (27%), but they still won comfortably. We still have trouble distinguishing between the 47 Smiths they have on the team (all of them are about 6’5 and wear headbands), but they combined for 38/9/6, while Lofton was otherwise limited (10 pts) (Tennessee 80, Temple 63). One question – will Temple ever be relevant again? The best game of the night that was televised was actually the Ohio-NMSU game. New Mexico St. played without stud freshman Herb Pope, but it was evened out because Ohio’s star forward Leon Williams spent most of the night on the bench in foul trouble anyway. The rest of the Ohio starters picked up for Williams, though (64/25/11), despite NMSU clearly having the more athletic team. Martin Iti (7’0, 240) has an NBA body, but why isn’t he more productive (8/9) (Ohio 80, New Mexico St. 72)?

Score of the Night. Stanford 111, the Tommy Amakers 56. None of the Stanford starters played more than 17 mins, and keep in mind they were w/o Brook Lopez in this game as well. The halftime score was 63-28. Good grief, man! Way to inspire confidence in your first game at Harvard, TA.

Upset Alert. UNC-Greensboro 83, Georgia Tech 74. Who said this yesterday – “upset alert if Ga Tech doesn’t come ready to play…” :-) It appears that mid-major all-american Kyle Hines absolutely shredded the Jackets’ front line (25/9/2 blks on 10-12 shooting). You never know what you’re going to get with Ga Tech, but UNCG is a team to watch as a potential at-large out of the SoCon next spring if they get a couple more of these. Belmont 86, Cincinnati 75. This really isn’t an upset, but Cincy was a 9-pt favorite at home. Wait… who said this yesterday also – “upset alert again – UC was horrid last year. Have they improved?” Now that we’re 2-0 this season on upset alerts, we’re quitting. Great BCS win for Belmont, who we perhaps foolishly did not pick to win the A-Sun again this year (gulp… we didn’t pick Gardner-Webb either). Belmont had 19 layups, 12 threes and 10 FTs, which amounted to 84 of their 86 points – now that’s efficiency. Wow. Other upsets: Tulane 77, Auburn 62 – maybe not the result, but the margin.

Line of the Night. There is no question about this one. Michael Beasley (Kansas St.) (34/24/4 assts/4 blks). 24 rebounds sets a new Big 12 conference record. Just sick numbers for a first game. Kansas St. 94, Sacramento St. 63.

Freshmen. Aside from Beasley at K-State, Kevin Love at UCLA also had an impressive debut (22/13) in a Bruin whomping (UCLA 69, Portland St. 48). The Duke trio of freshmen Kyle Singler, Nolan Smith and Taylor King combined for 51/14 in a complete and utter destruction of NC Central (Duke 121, NC Central 56). The Devils even pulled out some zone defense, they say.

In Memoriam. Wake Forest honored Skip Prosser by hanging a banner in their arena recognizing his contributions to the school and athletic program. The Deacons played hard and honored his legacy by winning easily (Wake Forest 85, Fairfield 60).

Nov. Bracketbuster. George Mason already helped their at-large profile with tonight’s win over Vermont, one of the better teams in the America East this year. GMU’s Will Thomas (yes, he’s still around) blew up for 16/17, overcoming the Patriots’ abysmal 1-17 from the three point line (George Mason 60, Vermont 53).

Joey Dorsey Award. We like him, but tonight’s award goes to Chris Lofton (Tennessee), for shooting 1-8 (0-5 from three) from the field and only scoring 10 pts. With a stroke like that, we expect nearly all of them to go in.

On Tap Today (all times EST). Another pretty big day with 63 games, although not much on tv because of college football. Here are some of the games to keep an eye for along the bottom line while you watch pigskin.

  • Yale (NL) v. Sacred Heart 1pm – presumptive favorites from the Ivy and NEC play.
  • Texas Tech (-19.5) v. UC Riverside (ESPN FC) 2pm – we have no idea why this is FC worthy.
  • Minnesota (NL) v. Army 3pm – Tubby’s debut will probably go a little better than Billy G’s last game.
  • USC (NL) v. Mercer 4pm – we cannot wait to see the OJ highlights from this one.
  • Bucknell (NL) v. Albany 7pm – a game that could affect seedings (#14 or #15) next March.
  • Oregon (-26) v. Pepperdine (ESPN FC) 7:30pm – how will the Ducks look w/o Aaron Brooks?
  • Vanderbilt (-12) v. Austin Peay 8pm – beating the dead horse here, but this is the kind of game we wish FC would have instead.
  • Marquette (NL) v. IUPUI (ESPN FC) 8:30pm – we’re not completely sold on MU – this could be an interesting game.
  • Pacific v. W. Michigan (-4.5) 9:30pm – if Pacific is back this year, they need to win this game.
Share this story

NBA Draft Picks by School Part III

Posted by rtmsf on June 28th, 2007

Today is the final installment of the three-part series where we wanted to take a look at the NBA Draft broken down by school over the history of the modern NBA Draft (1949-2006). In Part I, we examined the raw numbers and made a rudimentary attempt at tying NBA talent to NCAA Tournament success. In Part II, we broke out the raw numbers by round selected, and then further sliced that data into an examination of “Top 10” and “Top 5” selections. Today we finish off the series by looking at draft selections by decade, hoping to see how things have trended over the entire era of the NBA Draft. See Table C below.

Table C. NBA Draft Picks by School & Decade (1949-2006)

Notes: this table is sorted by the Total Draftees column, and is limited to schools with a minimum of ten or more draft picks since 1949. The yellow shading refers to the highest number in that column.

NBA Draft Picks by Decade v.1

Observations:

Consistency. The first thing that struck us as interesting were the schools that were fairly consistent in providing draft picks throughout the NBA Draft era. UNC, Louisville, Kentucky and St. John’s do not lead any particular decade, but each school has provided at least two picks per decade throughout. UCLA and Indiana have been similarly consistent over the entire period, but each also led a decade in picks (UCLA during the 70s; Indiana during the 80s).

Less Volume, but Still Consistent. Look at Big 10 stalwarts Illinois and Minnesota, along with Villanova and Utah. We’ve been clowning the Gophers all week, but surprisingly, they’ve consistently produced between 2 to 7 picks per decade – guess it’s easy to forget about Willie Burton and Joel Przybilla. The same is true for the Illini (between 2 to 7 per decade), Villanova (2 to 5) and Utah (2 to 5). Maryland, Syracuse, Ohio St., Marquette, Wake Forest, Temple, USC, Stanford, Memphis, Tennessee, Oregon, BYU, Mississippi St., LaSalle and Bradley are some of the other schools with at least one draft pick per decade.

USF Dons

The USF Dons Represent a Bygone Era

Whatever happened to…? The University of San Francisco, led by KC Jones and Bill Russell, produced fourteen draft picks from 1949-79, and only two since. Eight of Kansas St.‘s fourteen total draft picks were produced from 1949-69, but there’s only been one since 1989 (Steve Henson in 1990) – it even led the 1940s/50s with seven picks. And despite its recent renaissance under John Beilein and the proliferation of draft picks to come under Bob Huggins, West Virginia has only had one draft pick since 1968 (seven overall)! Another early producer Holy Cross (six overall) hasn’t had any picks since 1969; and Grambling (nine overall) hasn’t had any since 1978.

Arizona & UConn

These Two Schools Have Come On Strong

Late Bloomers. The biggest examples of late bloomers have to be Arizona and Connecticut. Arizona’s first draft pick was in 1974, and it has produced thirty-three more since, good enough for sixth (tied with UK) all-time. Connecticut is even more shocking – the Huskies’ first pick was Cliff Robinson in 1989 (!!!), but it has produced twenty picks since (1.11 picks per year). Duke also has to be mentioned here. The Devils had good success in the early years (seven picks through the 70s), but have had thirty-two draft picks since 1980, twenty-six of those since 1990 (1.44 picks per year). They were second in the 90s with fifteen picks, and are currently tied with UConn leading the 2000s with eleven picks. No wonder they’ve been so good. Other late bloomers include Georgia Tech (22 of its 24 picks since 1982), Michigan St. (24 of its 26 picks since 1979), Georgetown (17 of 18 since 1980), Alabama (19 of 23 since 1982), Texas (15 of 17 since 1982), and Georgia (13 of 14 since 1982). After tonight’s draft, Florida could have as many as 14 of its 15 picks since 1984, but we already knew the Gators were a late bloomer. As a bit of an anomaly among the traditional powers, Kansas didn’t really begin consistent production of draft picks until the 70s (24 of 27 picks since 1972).

Coaches. The one trend we see with many of these late bloomers is how important coaches are to the talent level of a program. UNC, Louisville, UCLA, Kansas, Kentucky and Indiana have had great coaches throughout most of their histories. It makes sense that these schools have also been the most consistent at putting talent into the NBA Draft. But look at some of the other schools, particularly the late bloomers. Jim Calhoun has been responsible for every single one of UConn’s draft picks; Lute Olson has been responsible for all but five of Arizona’s draft picks (85%), and Coach K for 74% of Duke’s all-time picks. Bobby Cremins at Georgia Tech (79%), John Thompson at Georgetown (83%), and the Jud Heathcote/Tom Izzo reign at Michigan St. (92%) show just how important a single coach can be to a program.

Final Thoughts. This has been a fun experiment, and in only a few hours, we get to update all of our data with draft data from 2007. Something tells us that Florida and Ohio State’s numbers are going to be rising. Thanks to everyone for your thoughts and commentary. We now return to our regularly scheduled programming…

Share this story

NCAA Tourney Overachievers and Underachievers of the 65 (64) Team Era

Posted by rtmsf on June 15th, 2007

We’ve received a resounding response on the post Tuesday evaluating school performance during the 65 (64) team era, so let’s waste no time in presenting Part II of our statistical profile of the NCAA Tournament during that period. As we alluded to in that post, looking at raw data in a vacuum has its limitations. From that data we got a reasonable sense of which programs have had the most success during the period, but it didn’t really give any insight as to which programs have overachieved, underachieved, or simply performed about as expected.

Ziggy

Which Schools Reach Their Potential?

Today’s post will address that issue. You might want to bookmark this page for next year’s bracket-filling, because we feel that what we’re showing today has significant value in determining those schools that tend to embrace expectations and those that tend to wither in the face of the red-hot lights of March. Stat geeks like ourselves should enjoy this post – hopefully it won’t bore the rest of you.

The first consideration in trying to determine which programs have overachieved and underachieved is how to answer that question. Traditionally, you often hear commentators and writers talk about “playing to your seed,” which essentially presumes that a #1 seed should make it to the Final Four, a #2 seed to the Elite Eight, and so on (see Table A below). Using this model, a team that wins any games beyond the expected wins of its seed would fairly be said to have overachieved as to the expectations of the seed (and vice versa).

Table A. Standard Model
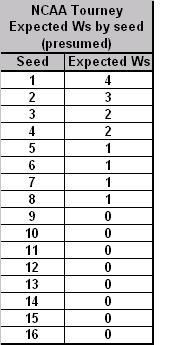
NCAA EV by Seed (Presumed)

So let’s try to first answer that question using the Standard Model outlined in Table A. But don’t give up on the post after you review the Standard Model results, as we have another model below it that may bring up new and interesting considerations. The Standard Model as applied to the 65 (64) Team Era is Table B below.

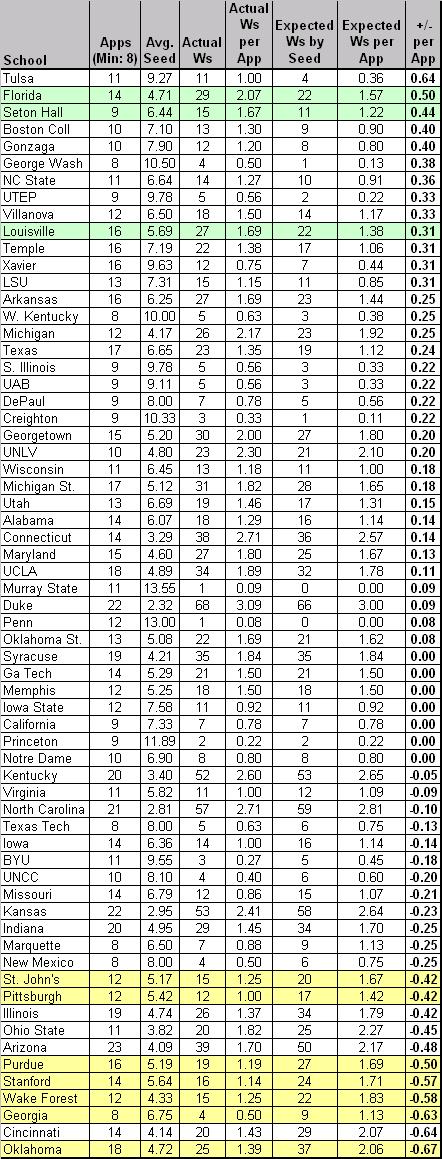
Table B. Standard Model Applied to 65 (64) Team Era

Notes: the table is sorted by “+/- per App,” which represents the number of games won above or below the expected number of wins for that seed per NCAA appearance (1985-2007). The rows colored in green highlight schools that are in the top twelve spots of both Tables B and D. The rows colored in yellow highlight schools that are in the bottom twelve spots of both Tables B and D.
NCAA EV by Seed - Detailed v.3

Inside the Numbers (Table B):

Overachievers. What first jumps out at us using this method is just how (except Florida) there are no big names near the top of the list. Tulsa, Seton Hall, GW, UTEP, Temple? Without taking away from their performance – after all, every one of those teams should be commended for overperforming versus its seed – this immediately suggests to us that the Standard Model often used by the pundits actually favors lower-seeded teams who manage to win a game or two every couple of years in the NCAA Tournament. Using the schools above +0.30 as a natural break point, only Florida, Louisville and Temple have won more than twenty games in the NCAAs during this period, and the average seed of these thirteen schools was 7.0. Are these teams chronically underseeded or are they overachieving as a general rule? Whatever the case, we’re going to think a little harder about picking Tulsa the next time they make the bracket.
Tulsa Logo

Are the Golden Hurricanes the Biggest NCAA Tourney Overachievers?

Underachievers. A brief look at the names at the bottom of the list – Oklahoma, Cincinnati, Wake Forest, Stanford, Purdue, etc. – tells us that we’re on to something here. As our good buddy MK says, “Wake and Purdue can effin’ bite me. They kill my bracket every year.” Or something like that. Using -0.42 as a natural break, the eleven teams at the bottom averaged a seed of 4.8 during this period, which is a marginally better seed than the overachievers on this list. Oklahoma, Arizona and Illinois – what do you have to say for yourselves? Each of you has had at least 18 appearances during this era, averaged a solid if not spectacular seed between #4 and #5, and consistently played below that seed to the tune of -0.42 wins per appearance or worse. This matches Tuesday’s analysis with Oklahoma as a disappointment; but under this model, Arizona and Illinois (second tier elite performers on Tuesday) have some explaining to do.

Oklahoma celebration

You May Want to Avoid These Guys in your Brackets

You’ll See Them Again on the Long Road Back to the Middle. The Big Four from Tuesday – Duke, UNC, Kentucky and Kansas – find themselves in the middle of the pack. It’s notable that Duke averaged a seed of 2.32 during this era and still overachieved by +0.09 wins per appearance relative to seed. UNC and Kentucky are verrrry slightly underachieving, whereas KU’s recent vintage teams (2005 & 2006) probably contribute to its slightly lesser position at -0.23 wins per appearance. UConn should be lauded for overachieving at a clip of +0.14 wins per appearance, which somewhat mitigates their overall lack of F4s – they do win a lot of NCAA Tournament games. Syracuse, Georgia Tech, Memphis, Iowa St., California, Princeton and Notre Dame – all of these programs have played exactly to seed in the last 23 years. Be sure to remember that fact next year when filling out your brackets.

Criticism of the Standard Model. The primary problem with evaluating NCAA Tournament success based on “playing to the seed” is that it puts an unrealistic burden on highly-seeded teams because over time they never play to their seed. In the knockout crucible that makes the NCAA Tournament so exciting, a corollary result of using this criteria is that higher seeds (#1-#4) are largely set up to fail, and lower seeds (#9-#16) are significantly overachieving simply by winning one game. Additionally, we feel that using the Standard Model assumes too much at the squishy margins – that a #4 seed should win two games, a #5 seed should win only one game, and that a #8 seed should always beat a #9 seed – when both teams are probably very similar in ability. For this reason, we now offer an alternative model, one that considers actual historical performance of the seeds.

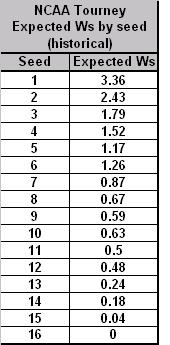
To that end, see Table C below for a historical snapshot of how well each seed actually performed in the 65 (64) team era.

Table C. Historical Model
NCAA EV by Seed - Historical

Considering Table C, we wanted to point out for a moment that we have a couple of thoughts. First, we found it interesting that #6 seeds have traditionally performed better than #5 seeds. This at first seems anathema to conventional wisdom, as a #6 likely has to get past a #3 in the second round, whereas a #5 must only defeat a #4. That is, until you remember that a #5 has the dreaded 5-12 match-up that knocks out so many higher-seeded teams (excepting 2007, of course). Also, it’s interesting that a #10 seed has a better historical expected number of wins than a #9 seed. This shows again that a better draw is to avoid the 8-9 match-up, even if you end up as a lower (but more likely to succeed) #10 seed.

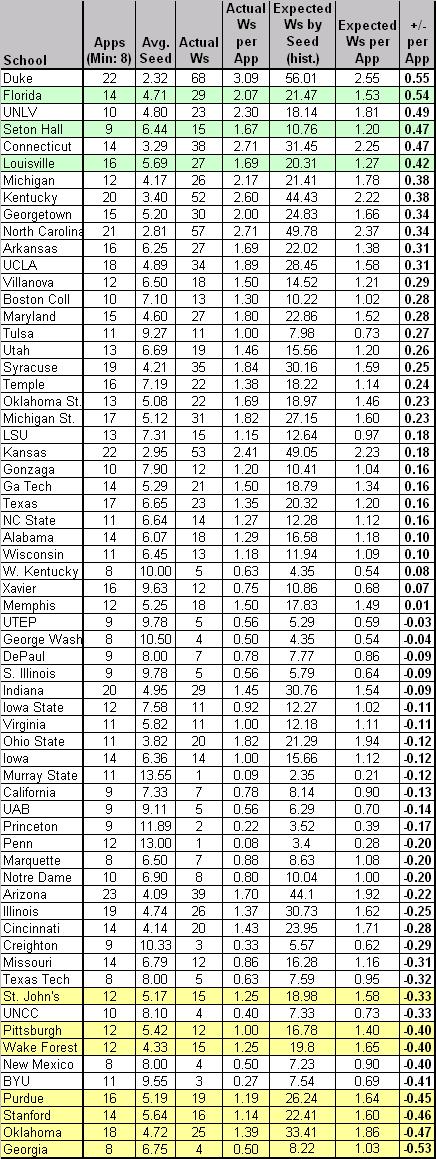
Using the 1985-2007 Historical Model as a baseline expected value for each seed, our list of 64 schools is now featured in Table D below.

Table D. Historical Model Applied to 65 (64) Team Era

Notes: the table is sorted by “+/- per App,” which represents the number of games won above or below the expected number of wins for that seed per NCAA appearance (1985-2007). The rows colored in green highlight schools that are in the top twelve spots of both Tables B and D. The rows colored in yellow highlight schools that are in the bottom twelve spots of both Tables B and D.
NCAA EV by Seed - Hist Detailed 3

Notable Differences. Using the Historical Model, the first thing that strikes us as interesting is that many of the heavy hitters of the era have jumped considerably, including some all the way to the top of the list. In fact, the following schools – Kentucky, UNC, Duke, Kansas, UConn, UNLV, UCLA, Syracuse, Ohio St. – all rose at least fifteen places from where they were situated in Table B. Each of these schools (excluding Kansas and Ohio St.) have overachieved at least +0.25 wins per appearance above the historical performance of their seeds. Since these schools represent a total of thirteen championships and thirty-eight F4s during this era, the Historical Model viewpoint makes more sense than what the Standard Model shows.

Who Dropped? Creighton, George Washington, UAB and UTEP all went from nice-looking overachievers in Table B to slight underachievers using this model. NC State, Xavier and Gonzaga looked fantastic using the Standard Model, but look rather pedestrian using this one. The explanation for this is simple – these teams collectively averaged a #9 seed throughout this era – if we use the Basic Model, they should never win a game, so when they do, it looks as if they’re significantly overachieving. However, using the Historical Model, we see that they actually win NCAA Tournament games roughly commensurate with how a #9 seed typically performs. This again illustrates why we feel this model shows a truer snapshot of performance.

More Importantly, Who Stayed the Same? Now this is where it gets really interesting. The rows shaded in green in Tables B and D represent schools that were in the top twelve in playing beyond its seed using both models. You could accurately say that, no matter how you slice it, Florida, Seton Hall and Louisville are the truest overachievers of the 65 (64) team era. (Incidentally, Florida and Seton Hall are in the top four of both tables, with each school averaging an extra win beyond its seed for every two appearances in the NCAA Tournament.)  These three schools consistently play beyond the actual and historical expected value of the seed that the NCAA Selection Committee gives them.  

The rows shaded in yellow at the bottom of Tables B and D represent the true underachievers. These schools were in the bottom twelve in playing below its seed using both models. What’s peculiar about this statistic is that there appears to be a much greater correlation between the tables with respect to the underachievers than with the overachievers. Whereas the overachievers only had three common schools between the tables, regular NCAA disasters such as Georgia, Oklahoma, Stanford, Purdue, Wake Forest, Pittsburgh and St. John’s find themselves in both at the bottom looking up. If you are at all like us and believe that the weight of history contributes as a predictor of the future, then anyone reading this post should be extremely hesitant picking these schools to play beyond its seed to its seed in the Dance in the years going forward.
Chicken or the Egg

And Now, the Chicken/Egg Argument. Whether you buy into the Standard Model or the Historical Model or neither, we can say without a doubt that some schools appear to consistently overachieve relative to its seed, while others consistently underachieve relative to its seed. The question we want to posit to the readers is what causes this – is this simply a statistical anomaly? Are the overachievers regularly seeded too low by the NCAA committee; or, are the underachievers regularly seeded too high? Is there a self-fulfilling prophecy at work here, where schools that are known as chronic underachievers (ahem, Oklahoma) place so much pressure on themselves that they tighten up in the clutch? Conversely, do the overachievers find their wits amidst chaos to consistently come through under pressure because they are expected to do so? These are questions that we cannot answer, but we figure that there are elements of each at play here. We’d certainly like to hear your thoughts on this and any other topic. Oh, and apologies for the long post today.

Coming Next: We’ll take a look at the raw numbers again, but this time we’ll examine it by conference, which isn’t as easy as it sounds. Do you realize how many conference re-alignments and mergers and dissolutions there have been in the last 23 years of NCAA basketball?


Share this story