The Argument for the 96 Team Tournament? 31 Fewer Hot Seats

Posted by nvr1983 on March 16th, 2010

Since the whispers started about the NCAA expanding March Madness to 96 teams opinion on the issue has been divided into camps: the traditionalists (bloggers) and the radicals (coaches). Wait a minute. What?!? Yes. That’s right. Bloggers want to stay old school and coaches want to throw a wrench into the established system. . .

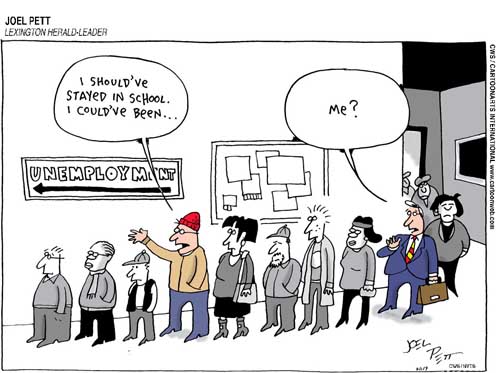
While coaches like to pontificate about expanding tournament to let more “deserving” teams in and give more players a chance to play in March Madness it is pretty clear to most neutral observers that the real motive is quite clear–keeping their jobs. With the recent spate of firings the coaches will continue to lobby hard for expansion. Since the season ended just a few days ago the list of coaching unemployed has grown to 6 coaches (and growing. . .):

  • Ernie Kent, Oregon (235-173 overall, 16-16 this season)
  • Jeff Lebo, Auburn (96-93, 15-17)
  • Todd Lickliter, Iowa (38-58, 10-22)
  • Bobby Lutz, Charlotte (218-158, 19-12)
  • Bob Nash, Hawaii (34-56, 10-20)
  • Kirk Speraw, UCF (279-233, 15-17)

Although a NCAA Tournament bid would not have guaranteed that these coaches kept their jobs, it would have most likely kept the boosters off their backs for some more time. And that’s all that a coach wants, right? Another year or two to collect a paycheck doing a substandard job and hoping to reach the longevity bonuses before they decide to get the booster funded golden parachute. Basically think of a college basketball version of investment bankers wanting to tweak the scoring metrics (adjust earnings in that case) to make themselves look better. Everyone knows how that turned out for the financial markets and the entire country.

Credit: Joel Pett (Lexington Herald-Leader)

You may see some familiar faces in the unemployment line

Now you’re probably asking yourself why the big-name coaches would care and that is a perfectly reasonable question with a perfectly reasonable answer. While the Mike Krzyzewskis and Jim Boeheims of the college basketball world will never have to worry about getting fired they have are plenty of their friends who are not quite as successful and that is not even talking about the dying branches on their coaching tree. Let’s take a look at some of their most famous branches:

  • Krzyzewski: Mike Brey, Tommy Amaker, Quin Snyder, Tim O’Toole, Bob Bender, Chuck Swenson, Mike Dement, and David Henderson
  • Boeheim: Rick Pitino, Tim Welsh, Louis Orr, Wayne Morgan, and Ralph Willard

Outside of Brey and Pitino that is a pretty mediocre group of coaches. Some of the others have had a modicum of success too, but overall that group has used more than its fair share of U-Haul trucks. And if the coaches don’t get their way they might be following in the footsteps of the late ODB.

Share this story

96-Team NCAA Tournament Capsule

Posted by zhayes9 on February 3rd, 2010

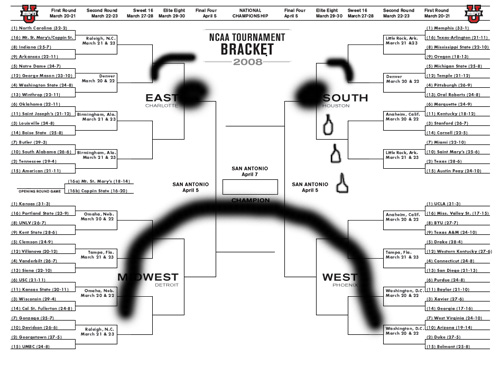
The recent report from Sports by Brooks relaying information from an insider ESPN source claiming NCAA Tournament expansion to 68 or 96 teams was a “done deal” caused tremendous frustration and anxiety amongst college basketball diehard fans and followers. The complaints are numerous and completely fair: the regular season would be rendered basically meaningless, the conference tournaments utterly ruined, the NCAA tournament field watered down to the point of being a joke. Fans are irate at the thought of destroying the greatest sporting event known to man. To confirm just how ridiculous the bracket would be if the tournament expands by 31 teams, here’s the rough layout of which teams would be dancing in a hypothetical 96-team field if the season ended today:

That's One Sad Bracket

Teams very comfortably in the field (#65-#73)

  • #65: Connecticut– 13-9 (3-6), 0-5 in true road games, 2-6 vs. RPI top 50
  • #66: South Carolina– 13-8 (4-3), losses to Miami and Wofford, 1-4 vs. RPI top 50
  • #67: Maryland– 14-6 (4-2), best non-conf win at Indiana, 1-6 vs. RPI top 50
  • #68: Wichita State– 19-4 (8-3), #164 SOS and #330 non-conf SOS, 3 losses vs. sub RPI top 100
  • #69: Tulsa– 17-4 (6-1), #62 RPI and #178 SOS, 1 win vs. RPI top 100
  • #70: North Carolina– 13-8 (2-4), #75 RPI, 1-6 vs. RPI top 50, only road win at NC State
  • #71: Mississippi State– 16-5 (4-2), #65 RPI and #167 SOS, 3 wins vs. RPI top 100, lost to Rider
  • #72: Illinois- 14-8 (6-3), #79 RPI, 2-4 vs. RPI top 50, losses to Bradley and Utah on neutral courts
  • #73: William & Mary– 15-6 (7-4), four losses in CAA including UNC-Wilmington, lost 3 of 4

Teams fairly comfortably in the field (#74-#82)

  • #74: Minnesota– 13-8 (4-5), #61 RPI, 3-7 vs. RPI top 100, losses to Indiana and Portland
  • #75: San Diego State– 16-6 (5-3), 2-5 vs. RPI top 50, losses to Pacific and Wyoming
  • #76: Virginia– 13-6 (4-2), #87 RPI and #118 SOS, losses to Penn State, Auburn, USF and Penn State
  • #77: South Florida– 14-7 (4-5), #207 non-conf SOS, 1-4 vs. RPI top 50
  • #78: Seton Hall– 12-8 (3-6), #174 non-conf SOS, 1-5 vs. RPI top 25, 8 losses overall
  • #79: Northwestern– 15-7 (4-6), 3-7 vs. RPI top 100, #246 non-conf SOS, 6 losses in Big 10 play
  • #80: Virginia Tech– 16-4 (3-3), #74 RPI and #255 SOS, #345 non-conf SOS, 0-2 vs. RPI top 50
  • #81: UTEP– 15-5 (6-1), #72 RPI and #141 SOS, 1-3 vs. RPI top 50, best non-conf win at NM St.
  • #82: Texas Tech– 14-7 (2-5), 0-7 vs. RPI top 50, best non-conf win vs. Wash, best conf win vs. Oklahoma

Read the rest of this entry »

Share this story

March Madness…And April Anxiety?

Posted by jstevrtc on February 1st, 2010

Call it what you want, but that’s what college basketball fans might be experiencing as soon as next season.

The buzz today among college hoops lovers is the latest talk regarding changes to that holiest of holies, the NCAA Tournament.  According to an article on the website SportsByBrooks from earlier today, after this season, the NCAA could very well opt out of its current deal with CBS and start negotiating with other networks for broadcasting rights, either in whole or in part.  We’re not saying it’s going to happen for sure, yet, and Jeff Goodman reported this afternoon that it’s not a “done deal” according to the NCAA.  But the talks that are evidently taking place about this are assuming an expanded tournament field — specifically, a 96-team beast — which would evidently meet with the approval of at least one big-time coach (and certainly countless others).

As for when the NCAA will make its decision, your guess is as good as any, but late spring/early summer would probably be a good bet.  Sports Business Journal, citing the NCAA’s RFP (request for proposals) on the matter, states that the organization has until August 31, 2010, to opt out of its current $6B deal with CBS, and can do so at any time prior to then.  Undoubtedly no decision will be made until after the 2010 season is complete, but with the NIT contract also up for renewal after this season, there’s a strong indication that the NCAA could be looking to fold that tournament into the Big Dance.  Other networks said to be in the mix for the Dance include ESPN (no surprise, they’ve been there), Fox (Joe Buck?  Calling NCAA hoops?), and Turner Sports (OK, now we’re alarmed – keep the Carays 500 miles away from any and all NCAA events).

Obviously, money is at the heart of these talks, as it is at the center of any negotiation.  Increasing the number of tournament teams by 50% to a 96-team weirdness would obviously add untold revenue to the pockets of both the NCAA and the winners of the TV rights.  It would also screw up the nice, even, symmetrical bracket and add a round or two of “bye games.”  Adding rounds means you’ll have venues dying to host those games, and probably an extra week added onto an event that already spreads eleven days of actual game play over three weeks.  And of course, the most important issue; the NCAA could never again hold up its alleged value of the term “student-athlete” as some badge of honor.  With money as the only motivating factor here, it sounds like they’d still be willing to pull a greater number of  students out of class for a longer amount of time.

Share this story

Great West Conference: Another Play-In Game on the Horizon

Posted by rtmsf on September 27th, 2008

Several sources today are announcing the formation of the 32d Division 1 league, the Great West Conference, which will begin organized basketball operations in the 2009-10 season.  You may recall that the GWC already exists in football as a transitional league between D2 and D1-AA (or whatever they’re calling it now).  The basketball counterparts at most of these schools have largely been relegated to the dreaded Independent status, which forces those teams to schedule games anytime, anywhere, anyplace, in order to complete a full schedule.  One of these teams, the much-maligned New Jersey Tech, made infamy last year with an 0-29 season, earning the lowest Sagarin rating (46.91) of the past several years.

Frankly, despite the league’s spin on the matter, reading down a list of these schools sounds a little like something out of the American Chiropractic Colleges Association manual.  Houston Baptist, Texas-Pan American, New Jersey Tech, Utah Valley, North AND South Dakota. Not to mention the fact that with two Texas schools, a Utah school, two Dakota schools and a freakin NEW JERSEY school, this new league is all over the place (Cal Poly, UC-Davis and Southern Utah, each of whom play in the football version of the GWC, are not expected to leave their basketball conferences – the Big West x2 and Summit, respectively).

In fact, looking at the map below, this “Great West” conference is 2,194 miles from east to west, 1,639 miles from north to south, and if you decided to drive the circuit between all six schools, it would take you through 22 states, 6,540 miles and approximately 41 Waffle Houses.  Oh, and only one team is even in a “western” time zone, with UVU in MST.

So what’s really going on here?  Of course, money.  The GWC is attempting to become the 32d league that gets an automatic bid to the NCAA Tournament, and while that may be a decade away (fulfilling all the requirements would take until 2020), Kyle Whelliston thinks that’s a possibility.

NCAA men’s basketball rules require conferences to pass a three-step eligibility check for auto-bid qualification: at least seven fully fledged Div. I members, seven that have been Div. I for at least eight years (known as “core members”), and six core members who have been league mates for five years. The current membership wouldn’t meet all of those guidelines until the year 2020.

You can rest assured that if the GWC eventually gets an automatic bid that the NCAA won’t take away one of the current 34 at-large bids, so the natural response would probably be to add another play-in game to the scorecard.  That would allow for two more teams to “make” the dance, and it would balance the brackets on both sides.  While this makes economic sense from an NCAA Tournament perspective, it’ll end up minimizing the achievements of the MEAC, SWAC and other league champions that have gotten accustomed to playing in the “real thing” on Thursday like everyone else.

And what happens to everyone’s bracket if one of these teams actually beats a #1 seed one of these days?

Share this story

NCAA Tourney Conference Overachievers and Underachievers (1985-2007)

Posted by rtmsf on July 11th, 2007

Today we’re ready to unleash the last installment of our analysis of NCAA Tournament stats of the 65 (64) team era… that is, unless we decide to analyze the coaches too… well, it is over three months until Midnight Madness, so ok, hold that thought.  Anyway, as you hopefully recall, during the weekend we took a look at the raw numbers of the era by conference, and essentially concluded that the ACC has been the most successful conference of the last 23 years, the Pac-10 SWAC/NEC the worst, and that the mid-major conferences may not have been as consistently good as we had hoped over the years.

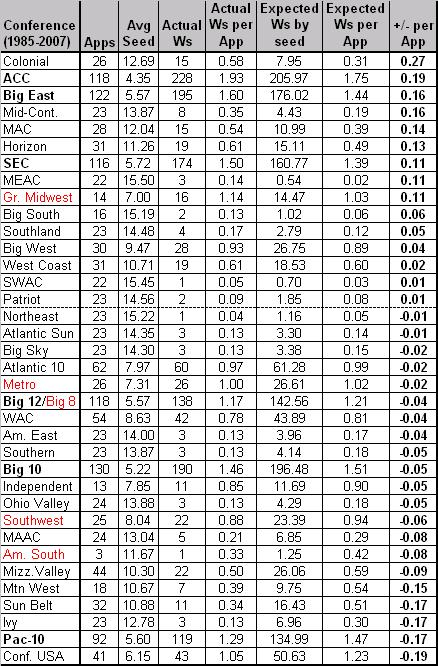
Now let’s take a look at the conferences who have overachieved and underachieved over the 65 (64) team era. In our analysis of this measure by school, you may remember that we looked at two different models – a Standard Model of expected wins by seed (e.g., a #1 seed should win 4 games per appearance), and a Historical Model of expected wins by seed (e.g., a #1 seed has actually won 3.36 games per appearance from 1985-2007). We concluded then that the true value lies in considering the Historical Model foremost because the Standard Model places too unrealistic of an expectation on high seeds and not high enough of one on low seeds, which ultimately skews its results in favor of lower-seeded schools and conferences. Given that condition, we now show the Overachiever and Underachiever conferences of the 65 (64) Team Era using the Historical Model. See Table A below.

Table A. Historical Model applied to 65 (64) Team Era

Notes: the table is sorted by “+/- per App,” which represents the number of games won above or below the expected number of wins for that seed per NCAA appearance (1985-2007). The conferences whose names are in bold are BCS conferences. The conferences whose names are in red are conferences that no longer exist.

NCAA Tourney by Conf v.3

Not Just George Mason. The first thought everyone will have (because we had it too) is that George Mason‘s miraculous run in 2006 accounts for the Colonial Conference’s rather aristocratic pedigree at the top of our list. But looking a little further inside the numbers somewhat mitigates this idea. Sure, the Masonites (as a #12 seed) won 3.52 games beyond its expected value of 0.48 wins per appearance in 2006, but that only accounts for half of the Colonial’s wins beyond expectation during this era. So where are the rest of the wins coming from? Thank David Robinson’s Navy squads of the mid-80s and Dick Tarrant’s Richmond Spiders in the immediate aftermath for the CAA’s perch as the biggest overachiever on our lofty list.

David Robinson

George Mason isn’t the only CAA School to Overachieve

BCStriation. Unlike our previous posting that used standard objective measures (wins, F4s, titles, etc.) to show that the six BCS conferences were without question the top six leagues of the era, today’s posting paints a substantially different picture. A league can be very successful objectively and still considerably underachieve, as in the strange case of the Pac-10 (and to a much lesser extent, the Big 10). Although the Pac-10 was clearly the weakest of the BCS conferences by the raw numbers, we certainly didn’t expect that it would be the second-worst underachiever of the 65 (64) team era – but it unquestionably is. The Pac-10 has won sixteen fewer games than it should have during this period, which dwarfs the negative output of any other conference – next in line for public shaming are Conference USA (7.6 wins fewer) and the Big 10 (6.5). Looking back at our list of chronic underachieving schools, we note that Stanford, Arizona and Cal all fall into the frequent NCAA underachievers list, which should have tipped us off that this was coming.

High Achievers. On the other side of things, the ACC and the Big East fall in line behind the CAA as the biggest overachievers of the era, which proves that you can get great seeds, have tremendous objective success in terms of wins and titles, and still overachieve as a conference. The ACC has won a whopping 22 games and the Big East 18 games beyond expectation; and the SEC isn’t far behind with 13. We also want to nod a tip of the hat to the Mid-Continent (+4.5 wins), MAC (+4 wins) and Horizon (+4 wins) conferences, each of which shows that leagues with consistently low seeds can do some damage on a regular basis in the NCAA Tournament.

Bradley

Missouri Valley Teams Need to Do More of This

What About…? If anything, these last two posts have opened our eyes to just how traditionally overrated the Missouri Valley Conference has been. For a so-called mid-major who gets multiple teams invited every year, its performance leaves a lot to be desired (4 wins below expectations). We realize that things change – conferences get better and worse over the years – but the MVC is going to have to really start producing in the next 5-10 years to lose our proffered overrated tag. As a comparison, the Horizon and West Coast conferences have performed nearly as well (19 wins each) as the MVC (22 wins) despite earning far fewer NCAA bids and having a slightly worse average seed.

Ivy League Paradox. We suppose that if you asked a hundred college basketball fans whether they believed the Ivy League traditionally overachieves in the NCAA Tournament, 99 of them would likely agree. This is probably due to a memorable upset or two over the years in addition to a common perception that the Ivies are a “tough out” every year. But looking above, we see quite starkly that the Ivy League has been one of the biggest underachievers of this era, earning only three wins versus an expected total of seven. This is largely because the Ivy champs (usually Penn or Princeton) have consistently earned seeds ranging from #11-#13 over the last decade, but haven’t been able to earn a single win during that period. The lesson here, we suppose, is to never take an Ivy team in your brackets (we’ve heard that taking an Ivy team against the spread in the first round is a good bet, however).

Share this story

NCAA Tournament Success in the 65 (64) Team Era by Conference

Posted by rtmsf on July 7th, 2007

Hope everyone had a great 4th of July holiday… although we gotta say this midweek holiday thing kinda sucks. Give us the three-day (or four!) day weekend instead.

Anyway, we’re now ready to unveil the conference follow-up to our June analysis of the Top NCAA Performers of the 65 (64) Team Era. Once again, we’re going to take several different views of the world here. Today we’ll just look at the raw statistics and make some obvious insightful observations. In the next post, we’ll take a look at how conferences have performed versus its seeds during this era, and whether we can draw any broad conclusions from the data about overachieving and underachieving conferences.

Conference

What Kind of Conference is This?

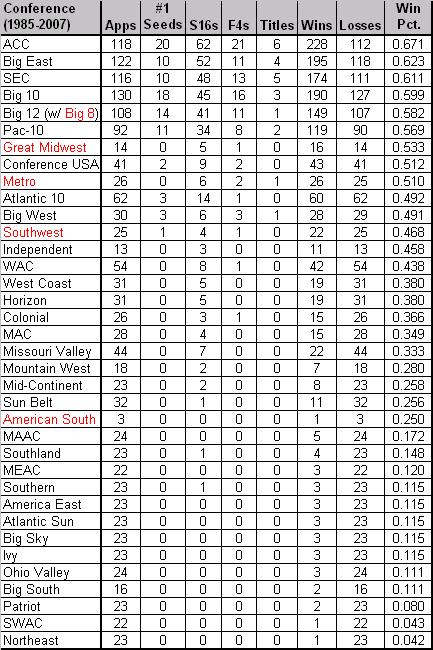
A couple of notes before rolling out the data. First, with only one notable exception, we counted a team’s performance in a given year toward the totals of its conference at the time. For example, Louisville’s 1986 national title counts toward the Metro Conference totals (the Metro disbanded in 1995), not the Big East totals. The notable exception is that all Big 8 totals were subsumed into the new Big 12 conference, since every member of the Big 8 ultimately became Big 12 members. See Table A below.

Table A. NCAA Tournament Success by Conference (1985-2007)

Notes: this table is sorted by winning percentage. The conferences whose names are in red are conferences that no longer exist.

NCAA Tournament Conferences v.5

BCS Conferences. This won’t surprise anyone, but we wanted to show the numbers in context. The following represents the percentage of each category achieved by the six BCS conferences from 1985-2007.

  • 46.4% of all NCAA Appearances
  • 60.9% Winning Percentage
  • 72.5% of all Wins
  • 76.6% of all Sweet 16s
  • 87.0% of all Final 4s
  • 90.2% of all #1 Seeds
  • 91.3% of all Titles

If you’re writing a paper on the correlation between resources, exposure, talent and success in NCAA basketball, the above numbers should be included in your first paragraph. It matters.

Best in Show

Best in Show?

Best in Show. Over this 23-year period, there can be no question that the ACC has been the strongest performer in the NCAA Tournament. This conference leads in every objective category except for appearances, which actually makes their hard numbers with respect to S16s, F4s and Titles look even more impressive. The most shocking finding for us regarding the ACC’s success was that more than half (52.5%) of its participants during this era won at least two games (i.e., made the Sweet 16). This is phenomenal, especially considering that the next-best major conference is the Big East at 42.6%. Of course, when you’re winning greater than two-thirds of your games as a conference, then it shouldn’t be that surprising.

Next Best. From our view, the next tier of conferences include the Big East, SEC and Big Ten – you can pretty much throw them all in a pot and pick any of the three as second behind the ACC. The Big East leads in S16s and winning percentage; the SEC leads in titles and mostly has middle-of-the-pack numbers otherwise; and the Big Ten leads in appearances and F4s. We rate the Big 12 slightly below this group because there seems to be a drop in most categories from the above three, most notably in winning percentage and titles (ouch – only one). But the Pac-10 clearly performs worst over this era, earning the fewest bids, having the worst winning percentage and owning by far the least wins, S16s and F4s.

Mid-Majors. From the numbers, we only recognize four true mid-major conferences during this period – the Metro/Great Midwest/CUSA and WAC/Mountain West hybrids, the Atlantic 10 and the Missouri Valley. What’s interesting is that only the Metro/GM/CUSA teams have a winning record during this period, while of course all of the BCS conferences easily have winning records. This shows once again just how large of a disparity there is between the three levels of college basketball. Remember when during the mid-90s, the A10 was supposedly overtaking the Big East in talent and performance? – the lesson here is to not believe the hype. Within that group, Metro/GM/CUSA has had the most success, led by Louisville, Cincinnati and Memphis. Now that two of those three are in the Big East, we don’t expect CUSA’s success to continue. We were also a little surprised at how low both The Valley and the Mountain West performed here – they have poor winning percentages and the Mountain West in particular has only put two teams (of 18 bids) into the Sweet Sixteen since its inception in 2000 – pathetic for an annual multi-bid league.

Tarkanian

Tark Has This Effect on Everyone

UNLV and Gonzaga Effect. The Big West and West Coast Conference exhibit how one very successful school can make a league look better than it actually is. By the numbers, the Big West looks like a mid-major league, but when broken down further, you quickly realize that the Rebels account for 21 of the conference’s 28 wins over this period. Excluding UNLV, the Big West is only 7-23 (.233) in the NCAA Tournament, which would put it on par with the Sun Belt and the Mid-Continent. The same is true with the WCC – when Gonzaga is excluded, the league is 7-21 (.250) during this period.

NEC

Stay Away from the NEC if you Want to Win in the NCAA Tournament

Low Majors. Picking a best conference among the low majors is a little like picking the prettiest ugly girl in the bar (not that we know anything about that, mind you), but if we have to choose, we’ll take the Southland Conference (note: we consider the conferences on the list above between the Great Midwest and the Sun Belt mid-majors, although the Sun Belt’s one S16 appearance with 32 bids is strong evidence that we might be giving that league too much credit). We choose the Southland because it’s one of only two of these conferences to put a team into the Sweet 16 (Karl Malone’s Louisiana Tech in 1985), and it has a better winning percentage than the others. We realize, of course, that all of these low majors are virtually equal in their NCAA ineptitude – only the Ohio Valley and the MAAC have ever received at-large bids (1987 – Middle Tennessee St.; 1995 – Manhattan) – but that’s our pick here. Our vote for the worst conference in D1 is a tie – the SWAC and the Northeast Conference. Each has the unenviable distinction of only winning one game in the NCAA Tournament during this period. Of course, maybe we’re looking at this the wrong way, and instead we should be celebrating the fact that every single conference has managed to win a game in the Dance during this period.

Final Thoughts. Can anyone catch the ACC? The Big East has a chance to tally significant gains if it continues to put eight teams into the NCAAs, as it did in 2006. But numbers alone probably isn’t enough – after all, the Big 10 has put the most teams in the Tournament since 1985. Rather, the ACC gives the obvious recipe for success by having two dominant programs that over the long haul consistently go deep into the NCAA Tournament (Duke and Carolina). Looking ahead, the Big East has an aging Calhoun at UConn and Boeheim at Syracuse so we’re not sure about its prospects. The Big 10 has Thad Matta the Recruiting Machine at OSU, but Michigan St. has regressed in recent years, and who else can rise up (Weber at Illinois? Beilein at Michigan? Tubby at Minnesota?). We’ll keep looking. The Pac-10 has an obvious supernova developing in Westwood at UCLA, but where else? Arizona will be in what kind of shape after Lute retires? Our choice for the conference to challenge the ACC in the next decade is the SEC. Billy Donovan at Florida has already proved his mettle; and with Billy Gillispie at Kentucky and Bruce Pearl at Tennessee challenging anyone to outwork them, it almost makes up for the coaching lightweights over in the SEC West (you know who we’re talking about). The youthful exuberance of these coaches at several programs willing to put forth the resources for success may give the SEC the best shot at catching the ACC, but the truth will ultimately lie in what happens to Duke after Coach K retires. If Duke manages to keep its dominance intact with their next coach, then it won’t much matter what happens with the other conferences – they’re not going to catch the ACC.

Coming Next: a look at how conferences overachieve and/or underachieve relative to their seeds over the years. Should be interesting stuff. Check back early next week.

Share this story

NCAA Tourney Overachievers and Underachievers of the 65 (64) Team Era

Posted by rtmsf on June 15th, 2007

We’ve received a resounding response on the post Tuesday evaluating school performance during the 65 (64) team era, so let’s waste no time in presenting Part II of our statistical profile of the NCAA Tournament during that period. As we alluded to in that post, looking at raw data in a vacuum has its limitations. From that data we got a reasonable sense of which programs have had the most success during the period, but it didn’t really give any insight as to which programs have overachieved, underachieved, or simply performed about as expected.

Ziggy

Which Schools Reach Their Potential?

Today’s post will address that issue. You might want to bookmark this page for next year’s bracket-filling, because we feel that what we’re showing today has significant value in determining those schools that tend to embrace expectations and those that tend to wither in the face of the red-hot lights of March. Stat geeks like ourselves should enjoy this post – hopefully it won’t bore the rest of you.

The first consideration in trying to determine which programs have overachieved and underachieved is how to answer that question. Traditionally, you often hear commentators and writers talk about “playing to your seed,” which essentially presumes that a #1 seed should make it to the Final Four, a #2 seed to the Elite Eight, and so on (see Table A below). Using this model, a team that wins any games beyond the expected wins of its seed would fairly be said to have overachieved as to the expectations of the seed (and vice versa).

Table A. Standard Model
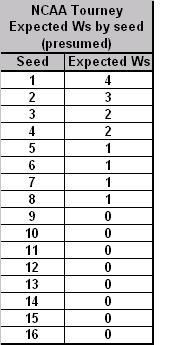
NCAA EV by Seed (Presumed)

So let’s try to first answer that question using the Standard Model outlined in Table A. But don’t give up on the post after you review the Standard Model results, as we have another model below it that may bring up new and interesting considerations. The Standard Model as applied to the 65 (64) Team Era is Table B below.

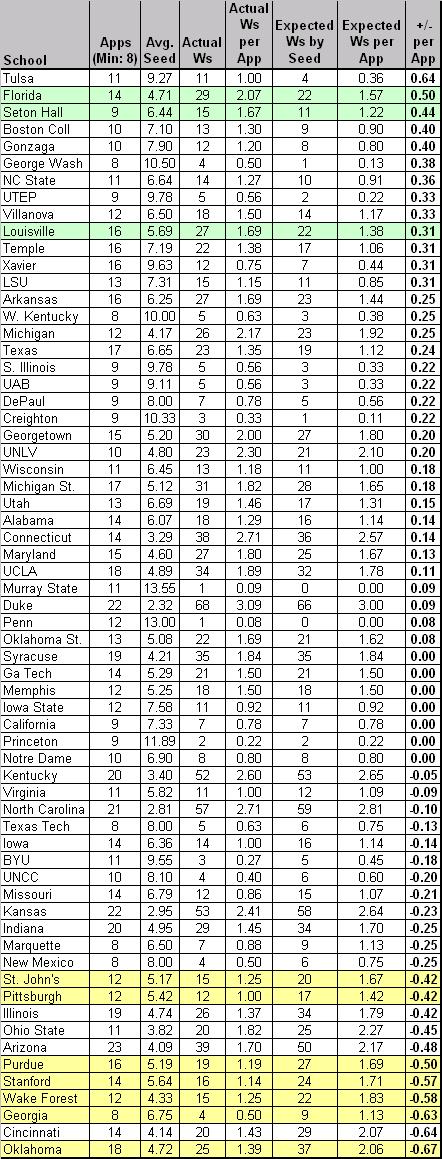
Table B. Standard Model Applied to 65 (64) Team Era

Notes: the table is sorted by “+/- per App,” which represents the number of games won above or below the expected number of wins for that seed per NCAA appearance (1985-2007). The rows colored in green highlight schools that are in the top twelve spots of both Tables B and D. The rows colored in yellow highlight schools that are in the bottom twelve spots of both Tables B and D.
NCAA EV by Seed - Detailed v.3

Inside the Numbers (Table B):

Overachievers. What first jumps out at us using this method is just how (except Florida) there are no big names near the top of the list. Tulsa, Seton Hall, GW, UTEP, Temple? Without taking away from their performance – after all, every one of those teams should be commended for overperforming versus its seed – this immediately suggests to us that the Standard Model often used by the pundits actually favors lower-seeded teams who manage to win a game or two every couple of years in the NCAA Tournament. Using the schools above +0.30 as a natural break point, only Florida, Louisville and Temple have won more than twenty games in the NCAAs during this period, and the average seed of these thirteen schools was 7.0. Are these teams chronically underseeded or are they overachieving as a general rule? Whatever the case, we’re going to think a little harder about picking Tulsa the next time they make the bracket.

Tulsa Logo

Are the Golden Hurricanes the Biggest NCAA Tourney Overachievers?

Underachievers. A brief look at the names at the bottom of the list – Oklahoma, Cincinnati, Wake Forest, Stanford, Purdue, etc. – tells us that we’re on to something here. As our good buddy MK says, “Wake and Purdue can effin’ bite me. They kill my bracket every year.” Or something like that. Using -0.42 as a natural break, the eleven teams at the bottom averaged a seed of 4.8 during this period, which is a marginally better seed than the overachievers on this list. Oklahoma, Arizona and Illinois – what do you have to say for yourselves? Each of you has had at least 18 appearances during this era, averaged a solid if not spectacular seed between #4 and #5, and consistently played below that seed to the tune of -0.42 wins per appearance or worse. This matches Tuesday’s analysis with Oklahoma as a disappointment; but under this model, Arizona and Illinois (second tier elite performers on Tuesday) have some explaining to do.

Oklahoma celebration

You May Want to Avoid These Guys in your Brackets

You’ll See Them Again on the Long Road Back to the Middle. The Big Four from Tuesday – Duke, UNC, Kentucky and Kansas – find themselves in the middle of the pack. It’s notable that Duke averaged a seed of 2.32 during this era and still overachieved by +0.09 wins per appearance relative to seed. UNC and Kentucky are verrrry slightly underachieving, whereas KU’s recent vintage teams (2005 & 2006) probably contribute to its slightly lesser position at -0.23 wins per appearance. UConn should be lauded for overachieving at a clip of +0.14 wins per appearance, which somewhat mitigates their overall lack of F4s – they do win a lot of NCAA Tournament games. Syracuse, Georgia Tech, Memphis, Iowa St., California, Princeton and Notre Dame – all of these programs have played exactly to seed in the last 23 years. Be sure to remember that fact next year when filling out your brackets.

Criticism of the Standard Model. The primary problem with evaluating NCAA Tournament success based on “playing to the seed” is that it puts an unrealistic burden on highly-seeded teams because over time they never play to their seed. In the knockout crucible that makes the NCAA Tournament so exciting, a corollary result of using this criteria is that higher seeds (#1-#4) are largely set up to fail, and lower seeds (#9-#16) are significantly overachieving simply by winning one game. Additionally, we feel that using the Standard Model assumes too much at the squishy margins – that a #4 seed should win two games, a #5 seed should win only one game, and that a #8 seed should always beat a #9 seed – when both teams are probably very similar in ability. For this reason, we now offer an alternative model, one that considers actual historical performance of the seeds.

To that end, see Table C below for a historical snapshot of how well each seed actually performed in the 65 (64) team era.

Table C. Historical Model
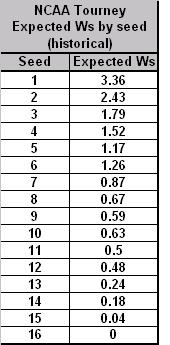
NCAA EV by Seed - Historical

Considering Table C, we wanted to point out for a moment that we have a couple of thoughts. First, we found it interesting that #6 seeds have traditionally performed better than #5 seeds. This at first seems anathema to conventional wisdom, as a #6 likely has to get past a #3 in the second round, whereas a #5 must only defeat a #4. That is, until you remember that a #5 has the dreaded 5-12 match-up that knocks out so many higher-seeded teams (excepting 2007, of course). Also, it’s interesting that a #10 seed has a better historical expected number of wins than a #9 seed. This shows again that a better draw is to avoid the 8-9 match-up, even if you end up as a lower (but more likely to succeed) #10 seed.

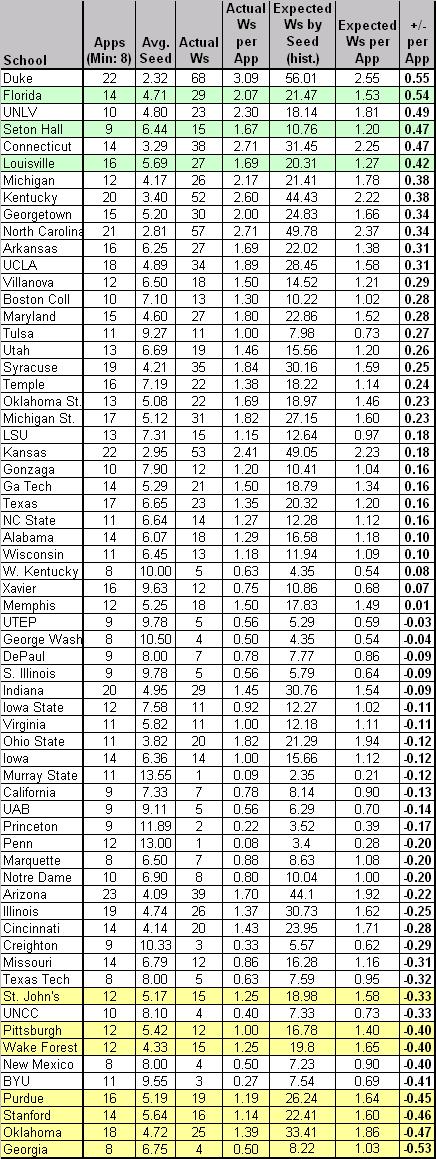
Using the 1985-2007 Historical Model as a baseline expected value for each seed, our list of 64 schools is now featured in Table D below.

Table D. Historical Model Applied to 65 (64) Team Era

Notes: the table is sorted by “+/- per App,” which represents the number of games won above or below the expected number of wins for that seed per NCAA appearance (1985-2007). The rows colored in green highlight schools that are in the top twelve spots of both Tables B and D. The rows colored in yellow highlight schools that are in the bottom twelve spots of both Tables B and D.
NCAA EV by Seed - Hist Detailed 3

Notable Differences. Using the Historical Model, the first thing that strikes us as interesting is that many of the heavy hitters of the era have jumped considerably, including some all the way to the top of the list. In fact, the following schools – Kentucky, UNC, Duke, Kansas, UConn, UNLV, UCLA, Syracuse, Ohio St. – all rose at least fifteen places from where they were situated in Table B. Each of these schools (excluding Kansas and Ohio St.) have overachieved at least +0.25 wins per appearance above the historical performance of their seeds. Since these schools represent a total of thirteen championships and thirty-eight F4s during this era, the Historical Model viewpoint makes more sense than what the Standard Model shows.

Who Dropped? Creighton, George Washington, UAB and UTEP all went from nice-looking overachievers in Table B to slight underachievers using this model. NC State, Xavier and Gonzaga looked fantastic using the Standard Model, but look rather pedestrian using this one. The explanation for this is simple – these teams collectively averaged a #9 seed throughout this era – if we use the Basic Model, they should never win a game, so when they do, it looks as if they’re significantly overachieving. However, using the Historical Model, we see that they actually win NCAA Tournament games roughly commensurate with how a #9 seed typically performs. This again illustrates why we feel this model shows a truer snapshot of performance.

More Importantly, Who Stayed the Same? Now this is where it gets really interesting. The rows shaded in green in Tables B and D represent schools that were in the top twelve in playing beyond its seed using both models. You could accurately say that, no matter how you slice it, Florida, Seton Hall and Louisville are the truest overachievers of the 65 (64) team era. (Incidentally, Florida and Seton Hall are in the top four of both tables, with each school averaging an extra win beyond its seed for every two appearances in the NCAA Tournament.)  These three schools consistently play beyond the actual and historical expected value of the seed that the NCAA Selection Committee gives them.  

The rows shaded in yellow at the bottom of Tables B and D represent the true underachievers. These schools were in the bottom twelve in playing below its seed using both models. What’s peculiar about this statistic is that there appears to be a much greater correlation between the tables with respect to the underachievers than with the overachievers. Whereas the overachievers only had three common schools between the tables, regular NCAA disasters such as Georgia, Oklahoma, Stanford, Purdue, Wake Forest, Pittsburgh and St. John’s find themselves in both at the bottom looking up. If you are at all like us and believe that the weight of history contributes as a predictor of the future, then anyone reading this post should be extremely hesitant picking these schools to play beyond its seed to its seed in the Dance in the years going forward.
Chicken or the Egg

And Now, the Chicken/Egg Argument. Whether you buy into the Standard Model or the Historical Model or neither, we can say without a doubt that some schools appear to consistently overachieve relative to its seed, while others consistently underachieve relative to its seed. The question we want to posit to the readers is what causes this – is this simply a statistical anomaly? Are the overachievers regularly seeded too low by the NCAA committee; or, are the underachievers regularly seeded too high? Is there a self-fulfilling prophecy at work here, where schools that are known as chronic underachievers (ahem, Oklahoma) place so much pressure on themselves that they tighten up in the clutch? Conversely, do the overachievers find their wits amidst chaos to consistently come through under pressure because they are expected to do so? These are questions that we cannot answer, but we figure that there are elements of each at play here. We’d certainly like to hear your thoughts on this and any other topic. Oh, and apologies for the long post today.

Coming Next: We’ll take a look at the raw numbers again, but this time we’ll examine it by conference, which isn’t as easy as it sounds. Do you realize how many conference re-alignments and mergers and dissolutions there have been in the last 23 years of NCAA basketball?


Share this story

Top NCAA Performers of the 65 (née 64) Team Era

Posted by rtmsf on June 12th, 2007

GMU Cartoon

Since there’s absolutely nothing going on this week, this is a good a time as any to start rolling out some of the data that we’ve been hoarding. First, a respectful tip of the hat goes to Florida Gator fan Louis Frank, who allowed us unbridled access to the detailed work in his NCAA Tournament database. Over the next week or so, we’re going to be presenting some descriptive statistics on the 64/65 team era of the NCAA Tournament sliced and diced in various ways.

Our first focus will be on individual team performance, viewed through the raw numbers and then with some analytical twists; then we’ll turn our attention to conference performance using the same parameters. The basic question we seek to answer is which teams and conferences tend to over- and underachieve in the NCAA Tournament since it expanded to 64 teams in the 1985 season? The reason we start with that somewhat arbitrary season is because from that point until now every championship team has had to win six games against seeded teams, with no exceptions. It also provides a tidy way of reviewing the data with a substantial sample of seasons – twenty-three – which also happens to coincide perfectly with the rise in popularity of NCAA basketball and the ESPN era.
NCAA Tournament Success (1985-2007)

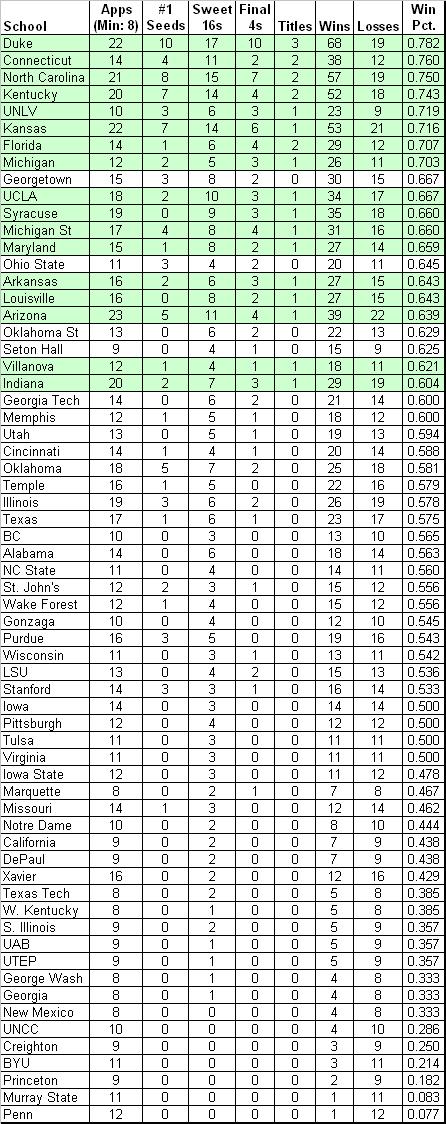
Notes: the chart is sorted by winning percentage (minimum: 8 appearances) from 1985-2007. The green shaded rows represent schools that have won a national title during this period.

NCAA Tournament 1985-2007 v.3

Inside the Numbers:

Elite Eight. Of the 267 schools that have been invited to the NCAA Tournament during the last 23 years, the 64 listed above are the chronic repeat performers, each having made the Dance on at least eight occasions. Thirty-nine of those sixty-four have winning (> .500) records, but only a handful, eight, are elite (> .700 winning pct.). Suffice it to say that those eight elite programs account for 14 of the 23 (61%) national championships and 39 of the 92 (42%) Final Four teams during this era (programs with a national title are denoted above in green shading). These eight programs are: Duke, Connecticut, UNC, Kentucky, UNLV, Kansas, Florida and Michigan. Incidentally, Georgetown is the only school of the top 13 who did not have a title from 85-07, but dumb luck led to its 1984 title team being omitted from this list – apologies to the Hoyas.

Coach K b/w

You Have to Give the Devil His Due

The Krzyzewski Era. This era also neatly coincides with the rise of Duke as a basketball powerhouse – Coach K’s first Final Four was in 1986, and his string of success particularly from 1988-92 exceeds by itself almost every other school’s performance on this list. Duke has the most #1 seeds, the most Sweet 16 appearances, the most Final Four appearances, the most wins, the best winning percentage and the most national titles during this period. In several of those categories it leads by comfortable margins. We’ve made note that the current era of Duke basketball might be slipping a tad, but with numbers like the above to sustain, that may be an impossible task even for Krzyzewski. By these numbers, you’d have to go with North Carolina in second place and Kentucky a close third. Each has very similar statistics (appearances, #1 seeds, sweet 16s, titles, wins, winning pct.) in all but one category, Final Fours. Given the importance that the college basketball community places on reaching the final weekend, Carolina’s seven F4s to Kentucky’s four must trump, all else being relatively equal.

Traditional Powers. With Duke, UNC and Kentucky taking the top three spots by the raw numbers, how do the other three traditional powers of UCLA, Kansas and Indiana fare? Kansas is closest to the top group. The Jayhawks mirror UNC in many categories (including F4s), but its winning percentage is a little lower and it lacks that second national title that would vault it into the top three. UCLA experienced a couple of down periods during this era, but now appears to be on the rise again with two F4s in the past two seasons. Still, its top ten winning percentage (.667) and its national title in 1995 keep it in the second tier of performers over this era. Indiana has largely struggled since Bob Knight was forced out of Bloomington, but their consistency in making the tournament and winning a game or two (.604 winning pct.) – plus that national title in 1987 – probably keeps it in the second tier as well. There should be no question, though – if any of the traditional six powers were slipping in favor of one or more of the nouveaux riche, Indiana would be the choice here.

Bob Knight IU

IU is Showing post-Knight Slippage

Nouveaux Riche. Of the elites, Connecticut and Florida are clearly the party-crashers. Prior to 1985, UConn had four wins and Florida zero wins in the NCAA Tournament. Each now has two national titles and a winning percentage of greater than .700. The question is whether these programs will be sustainable whenever Calhoun and Donovan decide to move on (Calhoun, to retirement; Donovan, as Christine’s full-time house-b*tch). The 64/65 team era is already littered with similar riches-to-rags stories such as UNLV, which fell hard when Tarkanian was indicted retired; and, Michigan, who also dropped out of the college basketball landscape once the gravy train of athlete peddler Ed Martin ended. Arkansas is yet another example – all three programs have a national title and multiple F4s to its credit, but long periods of poor teams and inconsistency places them in the second tier of the era.

Others in Second Tier. Several programs were consistenty excellent over this era, but their numbers weren’t as eye-popping as some of the above schools. Syracuse, Michigan State, Maryland and Louisville all claim a title to go with multiple F4s. Who knew other than Orange fans that Jim Boeheim’s squad never claimed a #1 seed during this era – that seems hard to believe. True, though – Syracuse’s best seeds were five #2s – during the glory days of Pearl Washington, DC, Billy Owens and company – 1986, 1987, 1989, 1990, and 1991. It looked like Michigan State was ready to become a top tier program 6-8 years ago, and they still are an excellent one, but its winning percentage needs to improve a little more to reach that level.

Lute Olson

The Silver Fox has had his Ups and Downs

Whither Arizona? Arizona is the only school that was invited to the NCAA Tournament each year of this era. Yet Arizona’s success in the postseason leaves something to be desired for a program of its stature – multiple F4s and a title, but near the bottom of the championship-level schools in winning percentage. The Wildcats are a team to keep a watchful eye on when we present our over- and under-acheivers list later this week.

Rising Stars. Several programs to observe closely as we go deeper into this era are rising stars Georgetown, Ohio St., Memphis, Texas and Gonzaga. None yet has a title during this era, but each except Gonzaga has been to a F4, and all five are knocking on the door. These programs have the facilities and coaching in place to continue to rise up this list in the coming years.

Disappointments. Again, basing these observations on nothing more than raw numbers, you’d have to say that Oklahoma, Illinois, Purdue and Stanford have been the biggest disappointments. Collectively, these schools have had fourteen #1 seeds with only five F4s to show for it (obviously, zero titles as well). Although most of these programs have been consistently invited to the NCAA Tournament during this era, none has a winning percentage topping .600.

Quin Snyder Norm Stewart

What did these two do to Missouri?

Embarrassments. We’ll leave the mid-majors like Xavier alone here, but we wanted to save special mention for some of the BCS schools who have managed to get invited multiple times, but really didn’t do much when they got there. Georgia‘s one sweet sixteen in eight appearances and its .333 winning percentage doesn’t say much for a program that always seems to be rebuilding; Bob Knight’s Texas Tech doesn’t fare much better (two sweet sixteens). But the real winner of the most pathetic NCAA-caliber program award, in our estimation, has to belong to Missouri. The Tigers have been to the tournament fourteen different times during this era, even once as a #1 seed, and have only managed three sweet sixteen appearances, two elite eights and an overall losing record (.462). Serious congrats are in order for Norm Stewart and Quin Snyder. Mike Anderson has his work cut out for him. The saddest part is that Mizzou traditionally likens itself as a basketball school!

Ivy Sadness. The last word goes to Ivy stalwarts Penn and Princeton, two schools who show up every year (21 of the last 23 NCAA Tournaments) at the right time and venue, battle hard for about thirty minutes against a superior athletic opponent, then go back home and lick their wounds for another year after inevitably wearing down to the size and strength of its opponent. They may be a collective 3-21 (.125) in the Dance, but who will forget when they pull the big upsets, like Princeton 43, UCLA 41 (1996), or Penn 90, Nebraska 80 (1994). Ok, maybe beating Nebraska isn’t a big upset after all, but we still love the UCLA upset.

Coming Next: now that we’ve analyzed the raw numbers of the 64/65 team era of the NCAA Tournament, we’ll next be taking a look at the over- and under-achievers during the same period. After seeing the above, can you project who the best and worst will be? You might be surprised at some of the results.  View Overachievers and Underachievers here.

Share this story