Ineligible Bachelors

Posted by rtmsf on August 29th, 2007

It’s that time of year again.

Classes are already in session at many of our nation’s fair universities, and the first few days of school are always the best. Every new class seems interesting; every freshman girl is a hook-up prospect; even the textbooks you just dropped $1000 on seem to hold promises of educational fulfillment within. That is, before boredom reality sets in and you realize that solving organic chemistry problems using those confounding erector sets still doesn’t make any sense and the freshman gals are just as completely and utterly uninterested in you as last year’s class was. Oh well – at least football’s starting and a case of Beast still only costs $6.99, right?

Coeds Sunning

You Still Have No Shot (even with the chub)

Along with the beginning of classes also comes another rite of fall passage – the annual news that some hoopsters around the nation didn’t get the job done in the classroom over the summer and will be academically ineligible for the fall semester. This usually doesn’t mean much from an on-court standpoint, because the players can still practice with the team – they just can’t play in any games until they’re eligible again. And given that most fall semesters end in mid-December, the amount of games any player tends to miss is usually in the single digits.

Already the following players have been declared ineligible for the fall semester:

  • Quinton WatkinsIllinois – incoming freshman leaves Bruce Weber with a thin backcourt after Jamar Smith’s DUI rendered him ineligible for the entire season
  • Lyndale BurlesonNevada – presumptive junior starting PG for Mark Fox’s squad didn’t have enough credits to become eligible
  • AJ RatliffIndiana – the senior guard (9.3 ppg last year) and Indiana Mr. Basketball will miss the first nine games of the season
  • Ra’Sean DickeyGeorgia Tech – 6’9 senior starting forward (8.1 ppg; 5.3 rpg) will also miss the first semester due to grades

Isn’t it odd how so many players become ineligible for the fall semester but seemingly always make the grades for the spring semester? We suppose that has something to do with the tutorial services available to athletes that may not be as comprehensive during the summer months. Consider how the Purdue women’s basketball team does it (h/t to Lion in Oil):

Former Purdue assistant Katrina Merriweather has admitted to typing and revising a paper for guard Cherelle George during the 2005-2006 season. Sociology 220 must have been harder for George than she’d expected. Witness the following email exchange between the two:

10/26/05, 4:45 PM Merriweather to George: Here are some thoughts that should help. Make sure you read it and add your own info from class notes or any textbooks you use. All of my info is from the internet and what I remember…

10/26/05, 10:16 PM Merriweather to George: Throw away the other one. This one is better and more organized….

11/29/05, 2:43 AM Merriweather to George: Hey, you still have to do the title page and the reference page. I have attached everything you need to do those (two) things. Make sure you reread the paper and make it sound like you.

Ahh yes, nothing like a little academic fraud to whisk in the fall semester. Happy studying, folks!

Share this story

08.27.07 Fast Breaks

Posted by rtmsf on August 27th, 2007

In the spirit of the new school year and the imminent college football season… 

  • First we offer the top 10 party schools in America.  Looking at the top 5, might there be a link between hedonism, the South and football? 
  • Speaking of the dirty South, this future Clemson grad wants us to know that she has “the Iraq’s” education on her mind, er, something like that… 
  • Moving back to our bread & butter, in a tragedy of Odin-esque proportions, Oregon plans to take Phil Knight’s $100M largesse and use it to build a new on-campus arena.  Sadly, McArthur Court will be tossed into the dustbin of great historical arenas.  Why doesn’t UO end the charade and just call themselves the Oregon Nikes from now on?
  • Richard Jefferson donated $3.5M to his alma mater Arizona for their new practice facility.  But he’s still only the third best UA alum in the NBA, according to fellow Cat Agent Zero.   
  • SLAM put out its early top 25 last week.  Intriguing omissions – Duke, Florida, Oregon.  Say what inclusions? – Clemson, Alabama, Cal.
  • Mike DeCourcey at TSN picks five teams from which he believes a 2008 champion will emerge – Georgetown, UNC, Kansas, UCLA and Memphis. 
  • All kinds of knee problems – Syracuse guard Andy Rautins blew out his left knee during the Tournament of the Americas while playing for Team Canada – the Cuse’s leading returning three-point shooter will miss the entire 2007-08 season.  Duke’s David McClure (6-8 weeks) and Bama’s Ronald Steele (ditto) also had less serious knee surgeries last week – both are expected to be 100% by the season.   
  • Illinois guard Jamar Smith will miss the season due to his DUI arrest in February.  He will be eligible to return to the team in the 2008-09 season.  Oh, and Jeff Goodman reminds us that Bruce Weber still can’t recruit.   
  • From the rumor mill –
    • Word is pickup basketball at UCLA got heated Monday when Golden State star point guard Baron Davis engaged in some trash-talking with heralded Southern Cal freshman point guard O.J. Mayo. Davis got upset with Mayo after he didn’t respect one of Davis’ calls. Word is Davis, a native of Los Angeles, told Mayo that he doesn’t know who he is other than the fact that he wasn’t from Los Angeles and he also needed to respect a veteran’s call. Word is Mayo more than held his own in the games. (h/t to Bruin Report Online)
  • Former ECU head coach Ricky Stokes has been paid $250,000 to not take the administrative job originally offered him after his demotion.   
  • In a sad and bizarre end to what was probably a tortured life, former one-and-done Seton Hall star Eddie Griffin died of an apparent suicide last week when he drove his car into a moving train.  RIP Eddie. 
  • Finally, from the opposite end of the spectrum, Butch van Breda Kolff, former Princeton coach and hoops purist, died at 84 last week.  As head coach, he led Bill Bradley’s Princeton Tigers to the 1965 Final Four, its only appearance.  RIP Butch. 


Share this story

NBA Draft Picks by School Part III

Posted by rtmsf on June 28th, 2007

Today is the final installment of the three-part series where we wanted to take a look at the NBA Draft broken down by school over the history of the modern NBA Draft (1949-2006). In Part I, we examined the raw numbers and made a rudimentary attempt at tying NBA talent to NCAA Tournament success. In Part II, we broke out the raw numbers by round selected, and then further sliced that data into an examination of “Top 10” and “Top 5” selections. Today we finish off the series by looking at draft selections by decade, hoping to see how things have trended over the entire era of the NBA Draft. See Table C below.

Table C. NBA Draft Picks by School & Decade (1949-2006)

Notes: this table is sorted by the Total Draftees column, and is limited to schools with a minimum of ten or more draft picks since 1949. The yellow shading refers to the highest number in that column.

NBA Draft Picks by Decade v.1

Observations:

Consistency. The first thing that struck us as interesting were the schools that were fairly consistent in providing draft picks throughout the NBA Draft era. UNC, Louisville, Kentucky and St. John’s do not lead any particular decade, but each school has provided at least two picks per decade throughout. UCLA and Indiana have been similarly consistent over the entire period, but each also led a decade in picks (UCLA during the 70s; Indiana during the 80s).

Less Volume, but Still Consistent. Look at Big 10 stalwarts Illinois and Minnesota, along with Villanova and Utah. We’ve been clowning the Gophers all week, but surprisingly, they’ve consistently produced between 2 to 7 picks per decade – guess it’s easy to forget about Willie Burton and Joel Przybilla. The same is true for the Illini (between 2 to 7 per decade), Villanova (2 to 5) and Utah (2 to 5). Maryland, Syracuse, Ohio St., Marquette, Wake Forest, Temple, USC, Stanford, Memphis, Tennessee, Oregon, BYU, Mississippi St., LaSalle and Bradley are some of the other schools with at least one draft pick per decade.

USF Dons

The USF Dons Represent a Bygone Era

Whatever happened to…? The University of San Francisco, led by KC Jones and Bill Russell, produced fourteen draft picks from 1949-79, and only two since. Eight of Kansas St.‘s fourteen total draft picks were produced from 1949-69, but there’s only been one since 1989 (Steve Henson in 1990) – it even led the 1940s/50s with seven picks. And despite its recent renaissance under John Beilein and the proliferation of draft picks to come under Bob Huggins, West Virginia has only had one draft pick since 1968 (seven overall)! Another early producer Holy Cross (six overall) hasn’t had any picks since 1969; and Grambling (nine overall) hasn’t had any since 1978.

Arizona & UConn

These Two Schools Have Come On Strong

Late Bloomers. The biggest examples of late bloomers have to be Arizona and Connecticut. Arizona’s first draft pick was in 1974, and it has produced thirty-three more since, good enough for sixth (tied with UK) all-time. Connecticut is even more shocking – the Huskies’ first pick was Cliff Robinson in 1989 (!!!), but it has produced twenty picks since (1.11 picks per year). Duke also has to be mentioned here. The Devils had good success in the early years (seven picks through the 70s), but have had thirty-two draft picks since 1980, twenty-six of those since 1990 (1.44 picks per year). They were second in the 90s with fifteen picks, and are currently tied with UConn leading the 2000s with eleven picks. No wonder they’ve been so good. Other late bloomers include Georgia Tech (22 of its 24 picks since 1982), Michigan St. (24 of its 26 picks since 1979), Georgetown (17 of 18 since 1980), Alabama (19 of 23 since 1982), Texas (15 of 17 since 1982), and Georgia (13 of 14 since 1982). After tonight’s draft, Florida could have as many as 14 of its 15 picks since 1984, but we already knew the Gators were a late bloomer. As a bit of an anomaly among the traditional powers, Kansas didn’t really begin consistent production of draft picks until the 70s (24 of 27 picks since 1972).

Coaches. The one trend we see with many of these late bloomers is how important coaches are to the talent level of a program. UNC, Louisville, UCLA, Kansas, Kentucky and Indiana have had great coaches throughout most of their histories. It makes sense that these schools have also been the most consistent at putting talent into the NBA Draft. But look at some of the other schools, particularly the late bloomers. Jim Calhoun has been responsible for every single one of UConn’s draft picks; Lute Olson has been responsible for all but five of Arizona’s draft picks (85%), and Coach K for 74% of Duke’s all-time picks. Bobby Cremins at Georgia Tech (79%), John Thompson at Georgetown (83%), and the Jud Heathcote/Tom Izzo reign at Michigan St. (92%) show just how important a single coach can be to a program.

Final Thoughts. This has been a fun experiment, and in only a few hours, we get to update all of our data with draft data from 2007. Something tells us that Florida and Ohio State’s numbers are going to be rising. Thanks to everyone for your thoughts and commentary. We now return to our regularly scheduled programming…

Share this story

NCAA Tourney Overachievers and Underachievers of the 65 (64) Team Era

Posted by rtmsf on June 15th, 2007

We’ve received a resounding response on the post Tuesday evaluating school performance during the 65 (64) team era, so let’s waste no time in presenting Part II of our statistical profile of the NCAA Tournament during that period. As we alluded to in that post, looking at raw data in a vacuum has its limitations. From that data we got a reasonable sense of which programs have had the most success during the period, but it didn’t really give any insight as to which programs have overachieved, underachieved, or simply performed about as expected.

Ziggy

Which Schools Reach Their Potential?

Today’s post will address that issue. You might want to bookmark this page for next year’s bracket-filling, because we feel that what we’re showing today has significant value in determining those schools that tend to embrace expectations and those that tend to wither in the face of the red-hot lights of March. Stat geeks like ourselves should enjoy this post – hopefully it won’t bore the rest of you.

The first consideration in trying to determine which programs have overachieved and underachieved is how to answer that question. Traditionally, you often hear commentators and writers talk about “playing to your seed,” which essentially presumes that a #1 seed should make it to the Final Four, a #2 seed to the Elite Eight, and so on (see Table A below). Using this model, a team that wins any games beyond the expected wins of its seed would fairly be said to have overachieved as to the expectations of the seed (and vice versa).

Table A. Standard Model

NCAA EV by Seed (Presumed)

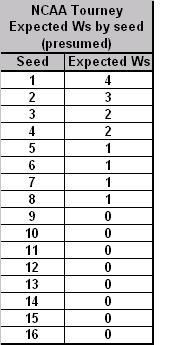
So let’s try to first answer that question using the Standard Model outlined in Table A. But don’t give up on the post after you review the Standard Model results, as we have another model below it that may bring up new and interesting considerations. The Standard Model as applied to the 65 (64) Team Era is Table B below.

Table B. Standard Model Applied to 65 (64) Team Era

Notes: the table is sorted by “+/- per App,” which represents the number of games won above or below the expected number of wins for that seed per NCAA appearance (1985-2007). The rows colored in green highlight schools that are in the top twelve spots of both Tables B and D. The rows colored in yellow highlight schools that are in the bottom twelve spots of both Tables B and D.

NCAA EV by Seed - Detailed v.3

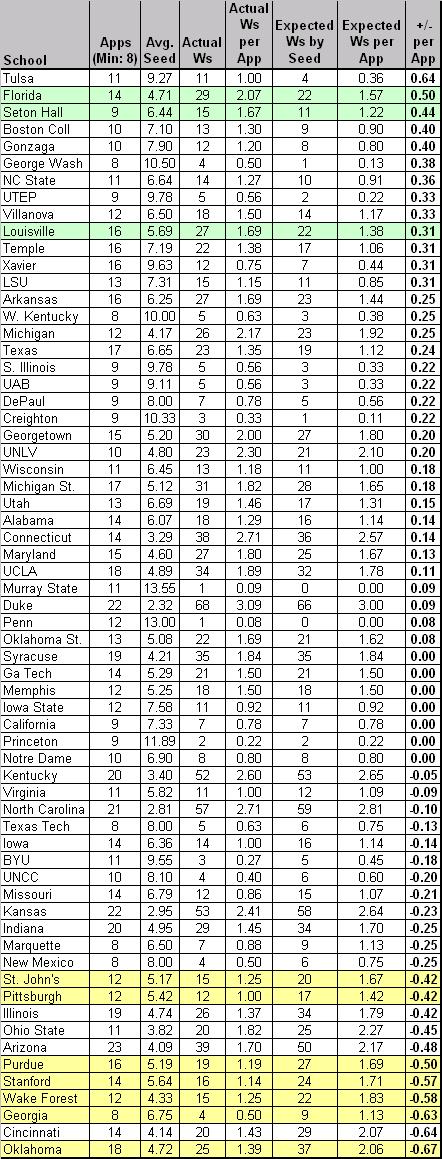
Inside the Numbers (Table B):

Overachievers. What first jumps out at us using this method is just how (except Florida) there are no big names near the top of the list. Tulsa, Seton Hall, GW, UTEP, Temple? Without taking away from their performance – after all, every one of those teams should be commended for overperforming versus its seed – this immediately suggests to us that the Standard Model often used by the pundits actually favors lower-seeded teams who manage to win a game or two every couple of years in the NCAA Tournament. Using the schools above +0.30 as a natural break point, only Florida, Louisville and Temple have won more than twenty games in the NCAAs during this period, and the average seed of these thirteen schools was 7.0. Are these teams chronically underseeded or are they overachieving as a general rule? Whatever the case, we’re going to think a little harder about picking Tulsa the next time they make the bracket.

Tulsa Logo

Are the Golden Hurricanes the Biggest NCAA Tourney Overachievers?

Underachievers. A brief look at the names at the bottom of the list – Oklahoma, Cincinnati, Wake Forest, Stanford, Purdue, etc. – tells us that we’re on to something here. As our good buddy MK says, “Wake and Purdue can effin’ bite me. They kill my bracket every year.” Or something like that. Using -0.42 as a natural break, the eleven teams at the bottom averaged a seed of 4.8 during this period, which is a marginally better seed than the overachievers on this list. Oklahoma, Arizona and Illinois – what do you have to say for yourselves? Each of you has had at least 18 appearances during this era, averaged a solid if not spectacular seed between #4 and #5, and consistently played below that seed to the tune of -0.42 wins per appearance or worse. This matches Tuesday’s analysis with Oklahoma as a disappointment; but under this model, Arizona and Illinois (second tier elite performers on Tuesday) have some explaining to do.

Oklahoma celebration

You May Want to Avoid These Guys in your Brackets

You’ll See Them Again on the Long Road Back to the Middle. The Big Four from Tuesday – Duke, UNC, Kentucky and Kansas – find themselves in the middle of the pack. It’s notable that Duke averaged a seed of 2.32 during this era and still overachieved by +0.09 wins per appearance relative to seed. UNC and Kentucky are verrrry slightly underachieving, whereas KU’s recent vintage teams (2005 & 2006) probably contribute to its slightly lesser position at -0.23 wins per appearance. UConn should be lauded for overachieving at a clip of +0.14 wins per appearance, which somewhat mitigates their overall lack of F4s – they do win a lot of NCAA Tournament games. Syracuse, Georgia Tech, Memphis, Iowa St., California, Princeton and Notre Dame – all of these programs have played exactly to seed in the last 23 years. Be sure to remember that fact next year when filling out your brackets.

Criticism of the Standard Model. The primary problem with evaluating NCAA Tournament success based on “playing to the seed” is that it puts an unrealistic burden on highly-seeded teams because over time they never play to their seed. In the knockout crucible that makes the NCAA Tournament so exciting, a corollary result of using this criteria is that higher seeds (#1-#4) are largely set up to fail, and lower seeds (#9-#16) are significantly overachieving simply by winning one game. Additionally, we feel that using the Standard Model assumes too much at the squishy margins – that a #4 seed should win two games, a #5 seed should win only one game, and that a #8 seed should always beat a #9 seed – when both teams are probably very similar in ability. For this reason, we now offer an alternative model, one that considers actual historical performance of the seeds.

To that end, see Table C below for a historical snapshot of how well each seed actually performed in the 65 (64) team era.

Table C. Historical Model

NCAA EV by Seed - Historical

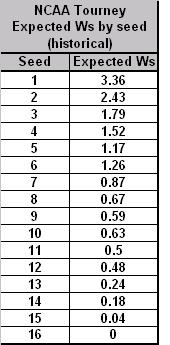
Considering Table C, we wanted to point out for a moment that we have a couple of thoughts. First, we found it interesting that #6 seeds have traditionally performed better than #5 seeds. This at first seems anathema to conventional wisdom, as a #6 likely has to get past a #3 in the second round, whereas a #5 must only defeat a #4. That is, until you remember that a #5 has the dreaded 5-12 match-up that knocks out so many higher-seeded teams (excepting 2007, of course). Also, it’s interesting that a #10 seed has a better historical expected number of wins than a #9 seed. This shows again that a better draw is to avoid the 8-9 match-up, even if you end up as a lower (but more likely to succeed) #10 seed.

Using the 1985-2007 Historical Model as a baseline expected value for each seed, our list of 64 schools is now featured in Table D below.

Table D. Historical Model Applied to 65 (64) Team Era

Notes: the table is sorted by “+/- per App,” which represents the number of games won above or below the expected number of wins for that seed per NCAA appearance (1985-2007). The rows colored in green highlight schools that are in the top twelve spots of both Tables B and D. The rows colored in yellow highlight schools that are in the bottom twelve spots of both Tables B and D.

NCAA EV by Seed - Hist Detailed 3

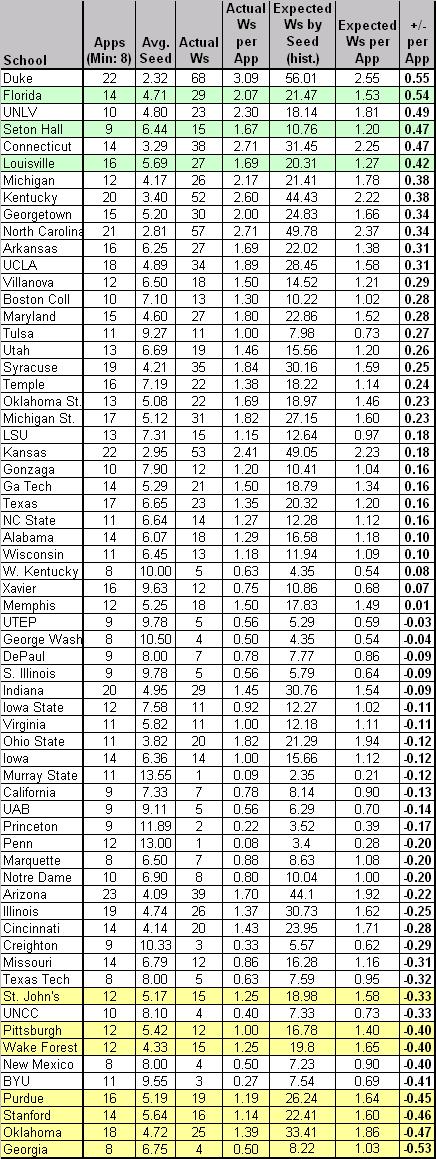
Notable Differences. Using the Historical Model, the first thing that strikes us as interesting is that many of the heavy hitters of the era have jumped considerably, including some all the way to the top of the list. In fact, the following schools – Kentucky, UNC, Duke, Kansas, UConn, UNLV, UCLA, Syracuse, Ohio St. – all rose at least fifteen places from where they were situated in Table B. Each of these schools (excluding Kansas and Ohio St.) have overachieved at least +0.25 wins per appearance above the historical performance of their seeds. Since these schools represent a total of thirteen championships and thirty-eight F4s during this era, the Historical Model viewpoint makes more sense than what the Standard Model shows.

Who Dropped? Creighton, George Washington, UAB and UTEP all went from nice-looking overachievers in Table B to slight underachievers using this model. NC State, Xavier and Gonzaga looked fantastic using the Standard Model, but look rather pedestrian using this one. The explanation for this is simple – these teams collectively averaged a #9 seed throughout this era – if we use the Basic Model, they should never win a game, so when they do, it looks as if they’re significantly overachieving. However, using the Historical Model, we see that they actually win NCAA Tournament games roughly commensurate with how a #9 seed typically performs. This again illustrates why we feel this model shows a truer snapshot of performance.

More Importantly, Who Stayed the Same? Now this is where it gets really interesting. The rows shaded in green in Tables B and D represent schools that were in the top twelve in playing beyond its seed using both models. You could accurately say that, no matter how you slice it, Florida, Seton Hall and Louisville are the truest overachievers of the 65 (64) team era. (Incidentally, Florida and Seton Hall are in the top four of both tables, with each school averaging an extra win beyond its seed for every two appearances in the NCAA Tournament.)  These three schools consistently play beyond the actual and historical expected value of the seed that the NCAA Selection Committee gives them.  

The rows shaded in yellow at the bottom of Tables B and D represent the true underachievers. These schools were in the bottom twelve in playing below its seed using both models. What’s peculiar about this statistic is that there appears to be a much greater correlation between the tables with respect to the underachievers than with the overachievers. Whereas the overachievers only had three common schools between the tables, regular NCAA disasters such as Georgia, Oklahoma, Stanford, Purdue, Wake Forest, Pittsburgh and St. John’s find themselves in both at the bottom looking up. If you are at all like us and believe that the weight of history contributes as a predictor of the future, then anyone reading this post should be extremely hesitant picking these schools to play beyond its seed to its seed in the Dance in the years going forward.

Chicken or the Egg

And Now, the Chicken/Egg Argument. Whether you buy into the Standard Model or the Historical Model or neither, we can say without a doubt that some schools appear to consistently overachieve relative to its seed, while others consistently underachieve relative to its seed. The question we want to posit to the readers is what causes this – is this simply a statistical anomaly? Are the overachievers regularly seeded too low by the NCAA committee; or, are the underachievers regularly seeded too high? Is there a self-fulfilling prophecy at work here, where schools that are known as chronic underachievers (ahem, Oklahoma) place so much pressure on themselves that they tighten up in the clutch? Conversely, do the overachievers find their wits amidst chaos to consistently come through under pressure because they are expected to do so? These are questions that we cannot answer, but we figure that there are elements of each at play here. We’d certainly like to hear your thoughts on this and any other topic. Oh, and apologies for the long post today.

Coming Next: We’ll take a look at the raw numbers again, but this time we’ll examine it by conference, which isn’t as easy as it sounds. Do you realize how many conference re-alignments and mergers and dissolutions there have been in the last 23 years of NCAA basketball?


Share this story

Top NCAA Performers of the 65 (née 64) Team Era

Posted by rtmsf on June 12th, 2007

GMU Cartoon

Since there’s absolutely nothing going on this week, this is a good a time as any to start rolling out some of the data that we’ve been hoarding. First, a respectful tip of the hat goes to Florida Gator fan Louis Frank, who allowed us unbridled access to the detailed work in his NCAA Tournament database. Over the next week or so, we’re going to be presenting some descriptive statistics on the 64/65 team era of the NCAA Tournament sliced and diced in various ways.

Our first focus will be on individual team performance, viewed through the raw numbers and then with some analytical twists; then we’ll turn our attention to conference performance using the same parameters. The basic question we seek to answer is which teams and conferences tend to over- and underachieve in the NCAA Tournament since it expanded to 64 teams in the 1985 season? The reason we start with that somewhat arbitrary season is because from that point until now every championship team has had to win six games against seeded teams, with no exceptions. It also provides a tidy way of reviewing the data with a substantial sample of seasons – twenty-three – which also happens to coincide perfectly with the rise in popularity of NCAA basketball and the ESPN era.

NCAA Tournament Success (1985-2007)

Notes: the chart is sorted by winning percentage (minimum: 8 appearances) from 1985-2007. The green shaded rows represent schools that have won a national title during this period.

NCAA Tournament 1985-2007 v.3

Inside the Numbers:

Elite Eight. Of the 267 schools that have been invited to the NCAA Tournament during the last 23 years, the 64 listed above are the chronic repeat performers, each having made the Dance on at least eight occasions. Thirty-nine of those sixty-four have winning (> .500) records, but only a handful, eight, are elite (> .700 winning pct.). Suffice it to say that those eight elite programs account for 14 of the 23 (61%) national championships and 39 of the 92 (42%) Final Four teams during this era (programs with a national title are denoted above in green shading). These eight programs are: Duke, Connecticut, UNC, Kentucky, UNLV, Kansas, Florida and Michigan. Incidentally, Georgetown is the only school of the top 13 who did not have a title from 85-07, but dumb luck led to its 1984 title team being omitted from this list – apologies to the Hoyas.

Coach K b/w

You Have to Give the Devil His Due

The Krzyzewski Era. This era also neatly coincides with the rise of Duke as a basketball powerhouse – Coach K’s first Final Four was in 1986, and his string of success particularly from 1988-92 exceeds by itself almost every other school’s performance on this list. Duke has the most #1 seeds, the most Sweet 16 appearances, the most Final Four appearances, the most wins, the best winning percentage and the most national titles during this period. In several of those categories it leads by comfortable margins. We’ve made note that the current era of Duke basketball might be slipping a tad, but with numbers like the above to sustain, that may be an impossible task even for Krzyzewski. By these numbers, you’d have to go with North Carolina in second place and Kentucky a close third. Each has very similar statistics (appearances, #1 seeds, sweet 16s, titles, wins, winning pct.) in all but one category, Final Fours. Given the importance that the college basketball community places on reaching the final weekend, Carolina’s seven F4s to Kentucky’s four must trump, all else being relatively equal.

Traditional Powers. With Duke, UNC and Kentucky taking the top three spots by the raw numbers, how do the other three traditional powers of UCLA, Kansas and Indiana fare? Kansas is closest to the top group. The Jayhawks mirror UNC in many categories (including F4s), but its winning percentage is a little lower and it lacks that second national title that would vault it into the top three. UCLA experienced a couple of down periods during this era, but now appears to be on the rise again with two F4s in the past two seasons. Still, its top ten winning percentage (.667) and its national title in 1995 keep it in the second tier of performers over this era. Indiana has largely struggled since Bob Knight was forced out of Bloomington, but their consistency in making the tournament and winning a game or two (.604 winning pct.) – plus that national title in 1987 – probably keeps it in the second tier as well. There should be no question, though – if any of the traditional six powers were slipping in favor of one or more of the nouveaux riche, Indiana would be the choice here.

Bob Knight IU

IU is Showing post-Knight Slippage

Nouveaux Riche. Of the elites, Connecticut and Florida are clearly the party-crashers. Prior to 1985, UConn had four wins and Florida zero wins in the NCAA Tournament. Each now has two national titles and a winning percentage of greater than .700. The question is whether these programs will be sustainable whenever Calhoun and Donovan decide to move on (Calhoun, to retirement; Donovan, as Christine’s full-time house-b*tch). The 64/65 team era is already littered with similar riches-to-rags stories such as UNLV, which fell hard when Tarkanian was indicted retired; and, Michigan, who also dropped out of the college basketball landscape once the gravy train of athlete peddler Ed Martin ended. Arkansas is yet another example – all three programs have a national title and multiple F4s to its credit, but long periods of poor teams and inconsistency places them in the second tier of the era.

Others in Second Tier. Several programs were consistenty excellent over this era, but their numbers weren’t as eye-popping as some of the above schools. Syracuse, Michigan State, Maryland and Louisville all claim a title to go with multiple F4s. Who knew other than Orange fans that Jim Boeheim’s squad never claimed a #1 seed during this era – that seems hard to believe. True, though – Syracuse’s best seeds were five #2s – during the glory days of Pearl Washington, DC, Billy Owens and company – 1986, 1987, 1989, 1990, and 1991. It looked like Michigan State was ready to become a top tier program 6-8 years ago, and they still are an excellent one, but its winning percentage needs to improve a little more to reach that level.

Lute Olson

The Silver Fox has had his Ups and Downs

Whither Arizona? Arizona is the only school that was invited to the NCAA Tournament each year of this era. Yet Arizona’s success in the postseason leaves something to be desired for a program of its stature – multiple F4s and a title, but near the bottom of the championship-level schools in winning percentage. The Wildcats are a team to keep a watchful eye on when we present our over- and under-acheivers list later this week.

Rising Stars. Several programs to observe closely as we go deeper into this era are rising stars Georgetown, Ohio St., Memphis, Texas and Gonzaga. None yet has a title during this era, but each except Gonzaga has been to a F4, and all five are knocking on the door. These programs have the facilities and coaching in place to continue to rise up this list in the coming years.

Disappointments. Again, basing these observations on nothing more than raw numbers, you’d have to say that Oklahoma, Illinois, Purdue and Stanford have been the biggest disappointments. Collectively, these schools have had fourteen #1 seeds with only five F4s to show for it (obviously, zero titles as well). Although most of these programs have been consistently invited to the NCAA Tournament during this era, none has a winning percentage topping .600.

Quin Snyder Norm Stewart

What did these two do to Missouri?

Embarrassments. We’ll leave the mid-majors like Xavier alone here, but we wanted to save special mention for some of the BCS schools who have managed to get invited multiple times, but really didn’t do much when they got there. Georgia‘s one sweet sixteen in eight appearances and its .333 winning percentage doesn’t say much for a program that always seems to be rebuilding; Bob Knight’s Texas Tech doesn’t fare much better (two sweet sixteens). But the real winner of the most pathetic NCAA-caliber program award, in our estimation, has to belong to Missouri. The Tigers have been to the tournament fourteen different times during this era, even once as a #1 seed, and have only managed three sweet sixteen appearances, two elite eights and an overall losing record (.462). Serious congrats are in order for Norm Stewart and Quin Snyder. Mike Anderson has his work cut out for him. The saddest part is that Mizzou traditionally likens itself as a basketball school!

Ivy Sadness. The last word goes to Ivy stalwarts Penn and Princeton, two schools who show up every year (21 of the last 23 NCAA Tournaments) at the right time and venue, battle hard for about thirty minutes against a superior athletic opponent, then go back home and lick their wounds for another year after inevitably wearing down to the size and strength of its opponent. They may be a collective 3-21 (.125) in the Dance, but who will forget when they pull the big upsets, like Princeton 43, UCLA 41 (1996), or Penn 90, Nebraska 80 (1994). Ok, maybe beating Nebraska isn’t a big upset after all, but we still love the UCLA upset.

Coming Next: now that we’ve analyzed the raw numbers of the 64/65 team era of the NCAA Tournament, we’ll next be taking a look at the over- and under-achievers during the same period. After seeing the above, can you project who the best and worst will be? You might be surprised at some of the results.  View Overachievers and Underachievers here.

Share this story

The West Side is the Best Side…

Posted by rtmsf on June 9th, 2007

2Pac

2Pac was right after all

Quite a bit was made last season of a renaissance in the quality of basketball in the Pac-10 conference, as it ended the season as a top three conference in both the RPI and Sagarin ratings in addition to earning a record six NCAA bids for the conference and enjoying the prestige as the only conference with multiple teams in the Elite Eight (Oregon and UCLA). There has always been a surplus of talent on the west coast, especially in the Seattle and SoCal areas, but it was largely characterized by players opting to play for an eastern school just as often as staying home to play for State U. This has been changing over the last five years, however, as new coaches such as Lorenzo Romar at Washington, Tim Floyd at USC, Tony Bennett at Wazzu and Ben Howland at UCLA have endeavored and succeeded in keeping as many of those talents as possible close to home. This is no more evident than in some of the recruiting wars over the last couple of years that resulted in top ten players such as Spencer Hawes (Washington), twins Brook & Robin Lopez (Stanford), Kevin Love (UCLA) and Brandon Jennings (Arizona) signing to play in the Pac-10 (notable exception: Lake Oswego’s (OR) Kyle Singler to Duke).

Steve Lavin

Lavin’s former conference is on the rise

Still, we were a little surprised when Rivals released its top ten players at each position for the 2007-08 season, and the Pac-10 claimed by far the most players, with thirteen of the top fifty. This is especially remarkable given that the league is losing all-conference performers Arron Afflalo (UCLA), Aaron Brooks (Oregon), Marcus Williams (Arizona) and Nick Young (USC) to the NBA next season, while it welcomes likely top fifty players Kevin Love and OJ Mayo (USC) to the league. With talent like this staying on the west coast, we should expect another great season from the Pac-10 conference next year. Somewhere Steve Lavin’s hair gel is celebrating.

The ACC and Big East have seven players each on the list; the SEC has six, and the the Big 12 has five of the top fifty players. The Mountain West and Conference USA both have three of the top fifty, outperforming the Big 10 (again), who only has two. The Colonial (Eric Maynor – VCU), Horizon (AJ Graves – Butler), Missouri Valley (Randal Falker – S. Illinois) and Southern (Stephen Curry – Davidson) conferences each have one top fifty player returning. Below is the list including multiple-player conferences:

Rivals 2007-08 Top 50 Players

You probably noticed that we shaded the teams with three top fifty players returning next season – Stanford, UCLA, UNC, Kansas. It’s certainly no coincidence that three of those will begin next year in the top five of the polls, and the fourth, Stanford, will probably be knocking on the door of the top ten.

Thoughts –

  • Where is all the Big Ten talent? Having less players on this list than CUSA and the Mountain West is cause for alarm, and helps to explain why only one Big Ten team played into the second weekend of the NCAA Tournament last season. Where are the usual stables of talent at Michigan State and Illinois? Aside from the yeoman’s work that Matta is putting into recruting at OSU, the rest of the Big Ten has signed only two top thirty prospects during the last three recruiting cycles – Joe Krabbenhoft of Wisconsin in 2005, and Eric Gordon of Indiana in 2007. An influx of coaching talent has entered the league (Tubby Smith at Minnesota and Kelvin Sampson at Indiana), but without the players to accompany those moves, the Big Ten is going nowhere fast.
  • Nitpicks. We probably would have found a place for the following players: Derrick Low (Washington St.), Edgar Sosa (Louisville), Jerel McNeal (Marquette), and Patrick Beverley (Arkansas). Expect each of these players to be all-conference performers in their respective leagues next season. We also have a sneaky feeling that guys like DaJuan Summers (Georgetown), Deon Thompson (UNC), Derrick Caracter (Louisville) and JaJuan Smith (Tennessee) will make a solid case to be on this list next season.
  • Surprises. NC State’s future looks bright with two young big men, Brandon Costner and Ben McCauley, returning for Sidney Lowe’s team. Alabama should be much improved next year as well, assuming Ronald Steele gets healthy (he was on many preseason all-american teams last year but struggled with tendinitis and ankle injuries that largely derailed Bama’s season). Apologies to the Mountain West, but who are Stuart Creason and Luke Nevill? Their inclusion on this list shows that the depth of talent at the center position in the college game is ridiculously thin.
  • Instant Impact Players in 2007-08. This list next season will be populated by the likes of OJ Mayo, Eric Gordon, Kevin Love, Michael Beasley (Kansas St.), Derrick Rose (Memphis) and Anthony Randolph (LSU).
Share this story

Top 10 Teams 1998-2007

Posted by rtmsf on May 9th, 2007

ESPN put out its top ten individual teams of the last decade, and we see some definite problems with some of their choices. First of all, only fourteen teams received votes, and we figure that at least four others – Kentucky 1998 (a champion, mind you), Arizona 2001 (runner-up), Duke 2002 and Arizona 1998 – deserve to be mentioned. As it stands, here is our list of the best teams of the past decade:

El-Amin and the Huskies shocked the world

El-Amin and the Huskies shocked the world

Team of the last decade?

1. UConn 1999 (34-2) – Nobody on this list had a better season from start to finish as this Huskies team. People tend to forget this team because it was considered at the time a bit of a fluke that they had beaten a loaded Duke team for the title, but they actually had held the #1 position for more weeks that season than Duke. Make no mistake about it, this team was legit across its lineup (Voskuhl, Freeman, Hamilton, El-Amin, Moore), and simply went about its business methodically winning game after game on its way to the championship.

2. Duke 1999 (37-2) – The primary reason UConn 1999 is #1 is because they proved their mettle by beating the sickest team of the last decade in a knockout championship game. Duke 1999 was the last “great” team of its era – along with its counterparts UNLV 1991, Duke 1992, and Kentucky 1996. This Duke team destroyed just about everyone they played all season long, but for a miraculous finish against a very talented Cincinnati squad in Alaska and the UConn “shock the world” game in the title match-up. A couple more baskets by Trajan Langdon and this team would be considered in the top five or ten of all-time.

3. Florida 2007 (35-5) – In terms of effectuating a repeat championship, and the manner in which they did it (virtually unchallenged in the NCAAs for two consecutive years), the 2007 Gators will be mentioned as one of the greatest teams of all-time. Horford, Noah, Brewer, Humphrey and Green were a true definition of “team,” with someone different stepping up in the clutch every time they needed it. However, a mind-boggling (albeit forgivable, considering the pressure on this team) mid-season hangover including ugly road losses against Tennessee and LSU are all that keeps this team from jumping to the top of the list with UConn 1999.

4. (tie) Duke 2001 (35-4) – This Duke championship team exhibits the type of team that wins titles in the 2000s – those with versatile inside/outside players, a solid core of experienced veterans, but not much depth. Battier, J-Will, Dunleavy, Boozer, and Duhon were an all-star cast that makes you wonder what has happened to K’s recruiting in the last few years.

4. (tie) UConn 2004 (33-6) – A belief in our eyes that this team was better than its record is based on Emeka Okafor’s back problems during this season. Coming from behind and closing out a scrappy Duke team in the final three minutes of the semifinals was a testament to just how good this team could be. Read the rest of this entry »

Share this story

Who says Bruce Weber can’t recruit?

Posted by rtmsf on April 25th, 2007

In the somehow-this-missed-us category, there were two separate articles over the weekend about an unsigned Class of 2007 prospect who otherwise would be fighting for recognition with all the other mid-major wannabes.  This player is a little different, though, as he just happens to be the eldest son of Basketball Messiah, aka Michael Jordan.  Jeffrey Jordan is a 6’1 guard from Deerfield (IL) Loyola Academy, who if you listen to the experts’ opinions, is the kind of player who takes his Valparaiso scholarship offer and considers himself lucky.   

Jeffrey Jordan

Nevertheless, it isn’t exactly normal that your dad hosts an annual all-star game at MSG involving the nation’s top prospects – the Jordan Classic – where you are one of the invitees.  Unless your name is Saul Smith we haven’t seen this level of nepotism since Jim Harrick, Jr., was giving exams at Georgia.  Honestly, we wish no ill will on the kid – he’s undoubtedly worked hard for everything he’s got.  And after all, recruiting maestro Bruce Weber clearly sees something in him, offering him “preferred walk-on” status at Illinois next year, whatever that means.

But don’t take our word for it, check out the MJ-esque hops here.   

Share this story