NCAA Tournament Success in the 65 (64) Team Era by Conference

Posted by rtmsf on July 7th, 2007

Hope everyone had a great 4th of July holiday… although we gotta say this midweek holiday thing kinda sucks. Give us the three-day (or four!) day weekend instead.

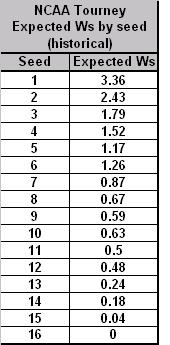
Anyway, we’re now ready to unveil the conference follow-up to our June analysis of the Top NCAA Performers of the 65 (64) Team Era. Once again, we’re going to take several different views of the world here. Today we’ll just look at the raw statistics and make some obvious insightful observations. In the next post, we’ll take a look at how conferences have performed versus its seeds during this era, and whether we can draw any broad conclusions from the data about overachieving and underachieving conferences.

Conference

What Kind of Conference is This?

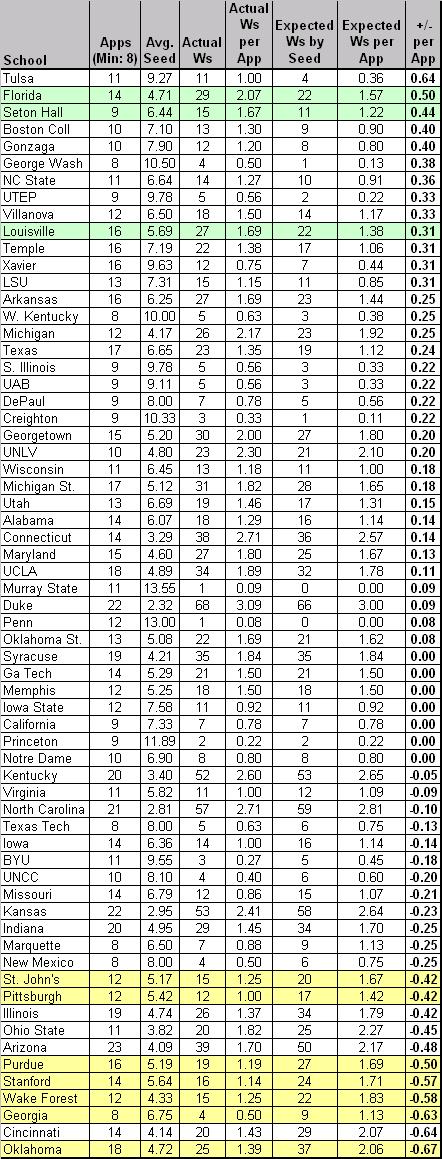
A couple of notes before rolling out the data. First, with only one notable exception, we counted a team’s performance in a given year toward the totals of its conference at the time. For example, Louisville’s 1986 national title counts toward the Metro Conference totals (the Metro disbanded in 1995), not the Big East totals. The notable exception is that all Big 8 totals were subsumed into the new Big 12 conference, since every member of the Big 8 ultimately became Big 12 members. See Table A below.

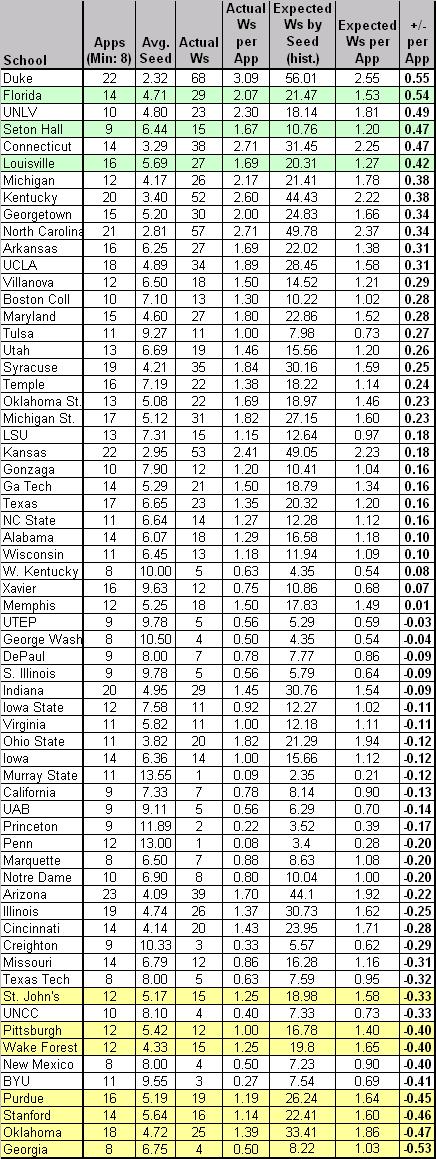
Table A. NCAA Tournament Success by Conference (1985-2007)

Notes: this table is sorted by winning percentage. The conferences whose names are in red are conferences that no longer exist.

NCAA Tournament Conferences v.5

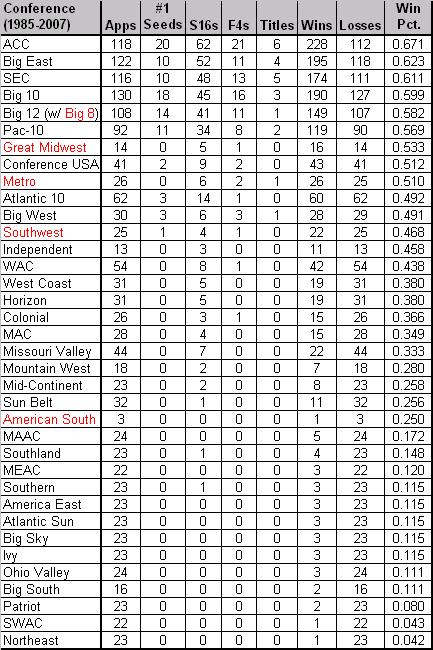
BCS Conferences. This won’t surprise anyone, but we wanted to show the numbers in context. The following represents the percentage of each category achieved by the six BCS conferences from 1985-2007.

  • 46.4% of all NCAA Appearances
  • 60.9% Winning Percentage
  • 72.5% of all Wins
  • 76.6% of all Sweet 16s
  • 87.0% of all Final 4s
  • 90.2% of all #1 Seeds
  • 91.3% of all Titles

If you’re writing a paper on the correlation between resources, exposure, talent and success in NCAA basketball, the above numbers should be included in your first paragraph. It matters.

Best in Show

Best in Show?

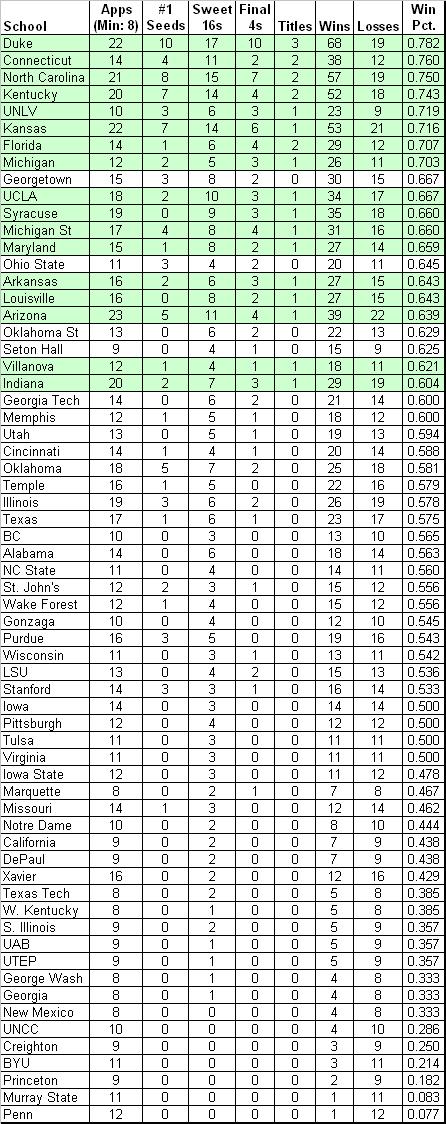
Best in Show. Over this 23-year period, there can be no question that the ACC has been the strongest performer in the NCAA Tournament. This conference leads in every objective category except for appearances, which actually makes their hard numbers with respect to S16s, F4s and Titles look even more impressive. The most shocking finding for us regarding the ACC’s success was that more than half (52.5%) of its participants during this era won at least two games (i.e., made the Sweet 16). This is phenomenal, especially considering that the next-best major conference is the Big East at 42.6%. Of course, when you’re winning greater than two-thirds of your games as a conference, then it shouldn’t be that surprising.

Next Best. From our view, the next tier of conferences include the Big East, SEC and Big Ten – you can pretty much throw them all in a pot and pick any of the three as second behind the ACC. The Big East leads in S16s and winning percentage; the SEC leads in titles and mostly has middle-of-the-pack numbers otherwise; and the Big Ten leads in appearances and F4s. We rate the Big 12 slightly below this group because there seems to be a drop in most categories from the above three, most notably in winning percentage and titles (ouch – only one). But the Pac-10 clearly performs worst over this era, earning the fewest bids, having the worst winning percentage and owning by far the least wins, S16s and F4s.

Mid-Majors. From the numbers, we only recognize four true mid-major conferences during this period – the Metro/Great Midwest/CUSA and WAC/Mountain West hybrids, the Atlantic 10 and the Missouri Valley. What’s interesting is that only the Metro/GM/CUSA teams have a winning record during this period, while of course all of the BCS conferences easily have winning records. This shows once again just how large of a disparity there is between the three levels of college basketball. Remember when during the mid-90s, the A10 was supposedly overtaking the Big East in talent and performance? – the lesson here is to not believe the hype. Within that group, Metro/GM/CUSA has had the most success, led by Louisville, Cincinnati and Memphis. Now that two of those three are in the Big East, we don’t expect CUSA’s success to continue. We were also a little surprised at how low both The Valley and the Mountain West performed here – they have poor winning percentages and the Mountain West in particular has only put two teams (of 18 bids) into the Sweet Sixteen since its inception in 2000 – pathetic for an annual multi-bid league.

Tarkanian

Tark Has This Effect on Everyone

UNLV and Gonzaga Effect. The Big West and West Coast Conference exhibit how one very successful school can make a league look better than it actually is. By the numbers, the Big West looks like a mid-major league, but when broken down further, you quickly realize that the Rebels account for 21 of the conference’s 28 wins over this period. Excluding UNLV, the Big West is only 7-23 (.233) in the NCAA Tournament, which would put it on par with the Sun Belt and the Mid-Continent. The same is true with the WCC – when Gonzaga is excluded, the league is 7-21 (.250) during this period.

NEC

Stay Away from the NEC if you Want to Win in the NCAA Tournament

Low Majors. Picking a best conference among the low majors is a little like picking the prettiest ugly girl in the bar (not that we know anything about that, mind you), but if we have to choose, we’ll take the Southland Conference (note: we consider the conferences on the list above between the Great Midwest and the Sun Belt mid-majors, although the Sun Belt’s one S16 appearance with 32 bids is strong evidence that we might be giving that league too much credit). We choose the Southland because it’s one of only two of these conferences to put a team into the Sweet 16 (Karl Malone’s Louisiana Tech in 1985), and it has a better winning percentage than the others. We realize, of course, that all of these low majors are virtually equal in their NCAA ineptitude – only the Ohio Valley and the MAAC have ever received at-large bids (1987 – Middle Tennessee St.; 1995 – Manhattan) – but that’s our pick here. Our vote for the worst conference in D1 is a tie – the SWAC and the Northeast Conference. Each has the unenviable distinction of only winning one game in the NCAA Tournament during this period. Of course, maybe we’re looking at this the wrong way, and instead we should be celebrating the fact that every single conference has managed to win a game in the Dance during this period.

Final Thoughts. Can anyone catch the ACC? The Big East has a chance to tally significant gains if it continues to put eight teams into the NCAAs, as it did in 2006. But numbers alone probably isn’t enough – after all, the Big 10 has put the most teams in the Tournament since 1985. Rather, the ACC gives the obvious recipe for success by having two dominant programs that over the long haul consistently go deep into the NCAA Tournament (Duke and Carolina). Looking ahead, the Big East has an aging Calhoun at UConn and Boeheim at Syracuse so we’re not sure about its prospects. The Big 10 has Thad Matta the Recruiting Machine at OSU, but Michigan St. has regressed in recent years, and who else can rise up (Weber at Illinois? Beilein at Michigan? Tubby at Minnesota?). We’ll keep looking. The Pac-10 has an obvious supernova developing in Westwood at UCLA, but where else? Arizona will be in what kind of shape after Lute retires? Our choice for the conference to challenge the ACC in the next decade is the SEC. Billy Donovan at Florida has already proved his mettle; and with Billy Gillispie at Kentucky and Bruce Pearl at Tennessee challenging anyone to outwork them, it almost makes up for the coaching lightweights over in the SEC West (you know who we’re talking about). The youthful exuberance of these coaches at several programs willing to put forth the resources for success may give the SEC the best shot at catching the ACC, but the truth will ultimately lie in what happens to Duke after Coach K retires. If Duke manages to keep its dominance intact with their next coach, then it won’t much matter what happens with the other conferences – they’re not going to catch the ACC.

Coming Next: a look at how conferences overachieve and/or underachieve relative to their seeds over the years. Should be interesting stuff. Check back early next week.

07.03.07 Fast Breaks

Posted by rtmsf on July 3rd, 2007

Quite a bit of stuff we’ve missed over the past week or so… 

  • Iowa transfer and Tennessee native Tyler Smith will be eligible to play at UT next season, as his appeal was approved by the NCAA.  UT just moved into our Top 5 for 2007-08.   
  • Florida guard Brandon Powell‘s arrest for possession of a little ganja results in a transfer – expect to see him at Oklahoma St. or WVU next year.
  • Cliff Ellis resurfaces at Coastal Carolina – we guess there are worse places than Conway, South Carolina
  • Apparently the NCAA will revisit its recently-enacted text messaging ban after 34 schools asked for a review.   
  • Indiana will tear down Assembly Hall (the House that Knight built) and Auburn will tear down Beard-Eaves Coliseum (the House that…  um…  Barkley?  The Rifleman?  built?) in favor of new barns. 
  • New Mexico St. coach Reggie Theus alighted for the Sacto Queens and the golden opportunity to coach Spencer Hawes, opening the door for Louisville assistant coach Marvin Menzies to take over in Las Cruces.  Former UK & Celtic favorite and longtime crooner Walter McCarty will take the open position on Pitino’s staff.   
  • John Hollinger at espn.com (Insider, but if you look around you can find it copied/pasted elsewhere) has a tremendous article on evaluating college players before the draft. 
  • It’s never too early.  Chad Ford’s Top 10 for the 2008 Draft.  While we’re at it, here’s the projected mocks on NBADraft.net (2008 and 2009).     
  • Seth Davis has an interesting piece on the Under-19 USA team.  Looking at Sunday night’s box score – Stephen Curry continues to impress. 
  • UK has signed just about everyone lately, as Billy Gillispie has the Wildcat fans giddy over his recruiting prowess during his first three months on the job.  Oh, and he hasn’t found a place to live yet (has he looked?). 
  • Duke Dorks feigning comedy.  Jon Scheyer acting walking around campus with a camera nearby. 

2007 NBA Draft Musings

Posted by rtmsf on June 29th, 2007

Note:  If you’re looking for the 2008 NBA Draft Musings, look here. 

Some post-apocalyptic draft thoughts for your Friday, as we settle into a long summer of waiting for something to happen…

Oden

Championship or Bust in Portland?

  • One and Dones. These players acquitted themselves quite well in this year’s draft, which means they were getting good information from their schools and representatives. Greg Oden, Kevin Durant, Mike Conley, Jr., Brandan Wright, Spencer Hawes and Thaddeus Young were six of the top twelve players taken. Not coincidentally, five of those were among the top seven seniors of the Class of 2006, according to Rivals (Chase Budinger of Arizona was the lone holdout returning to school, and Conley was rated #18). Javaris Crittenton and Daequan Cook were also selected in the first round, meaning that every college freshman who declared was taken this year. Although it’s arguable whether the one-and-done system worked for college basketball (Ohio State – yes; Washington – no), we assert from a player perspective that it helped them exponentially in terms of marketability and readiness to perform at the next level. Every sports fan in America now knows who Greg Oden and Kevin Durant are – that wouldn’t have been the case prior the one-and-done rule.
  • Gator Rule. As we alluded to yesterday, the Florida Gators were set to greatly increase its all-time count of draft picks last night, and they did so with a flourish (see Joakim Noah‘s getup below), increasing its total from 10 to 15 overnight. Florida’s five entries into the NBA last night – Al Horford, Corey Brewer (who looked like the happiest man alive), Noah, Chris Richard (we figured he’d get a look), and Taurean Green – ties UConn for the most draft picks in one year. What, no Lee Humphrey?!?! The Huskies also entered five in 2006. One question, though. Where was Billy Donovan during this celebration of Pax Floridana? Maybe Christine hasn’t let him out of the house yet.

Joakim Noah Suit

Love the Seersucker, Jo

  • Conference Breakdown. The BCS conferences accounted for 39 of the 60 picks last night. The ACC (9 total; 6 first rounders) led the way, with the SEC close behind (8/3); the Big 10 (6/4), Pac-10 (6/4) and Big East (6/2) each showed moderate success, while the Big 12 fell behind the others (4/3). Considering that there were thirteen international players selected, that left only eight picks for the mid-majors. The highest mid-major player selected was Rodney Stuckey from Eastern Washington at #15; although Nevada also placed two players in the second round (Nick Fazekas and Ramon Sessions).
  • Dumb Declarations. By our count, only four players from D1 schools who stayed in the draft as an early entry candidate were not selected this year (most notably, Shagari Alleyne, formerly of Kentucky). This shows again that players are improving at determining their real value (vs. perceived inflated value) before making the decision to jump.

“Why Didn’t I Go Pro Last Year????”

  • A Year Late, A Dollar Short. Three players from big-name schools were probably kicking themselves for not leaving school early last year, when their weaknesses weren’t as exposed to the scouts. Duke’s Josh McRoberts (offensive skills), LSU’s Glen “Big Baby” Davis (weight issues) and Arizona’s Marcus Williams (headcase) all would have been much higher picks last year. Now each must battle for scraps as second-round selections this time around.
  • Parlez vous français? We always hate to see guys who put in their four years at college and were pretty good players, only to get passed over in the draft for Pau Gasol’s little brother. So a special shout-out goes to Zabian Dowdell (Virginia Tech), JR Reynolds (Virginia), Curtis Sumpter (Villanova), Mario Boggan (Oklahoma St.), Ekene Ibekwe (Maryland) , Brandon Heath (San Diego St.), Ron Lewis (Ohio St.) and Kyle Visser (Wake Forest) for providing wholesome collegiate entertainment over the last half-decade. We were tempted to also include Mustafa Shakur (Arizona) here, but he seemed to disappoint more than inspire during his tenure in Tucson.

SLAM Oden & Durant

Oden Wins Championships; Durant Wins Scoring Titles.

  • Final Thought. Oden vs. Durant was endlessly debated all season long. While we have to agree that we enjoy watching Durant play far more than Oden, that belies our bias against watching post men in favor of perimeter players in general. Still, Oden is the kind of player that championship teams are built around, and the Durants of history are comparitively light in the hardware department. We saw this played out in this year’s NCAA Tournament, where Oden’s team went to the national finals, and Durant’s squad was out (embarrassingly) in the second round. Either way, we wish the best of luck to both of them, as they made college basketball a more interesting game for the year they spent with us.

NBA Draft Picks by School Part III

Posted by rtmsf on June 28th, 2007

Today is the final installment of the three-part series where we wanted to take a look at the NBA Draft broken down by school over the history of the modern NBA Draft (1949-2006). In Part I, we examined the raw numbers and made a rudimentary attempt at tying NBA talent to NCAA Tournament success. In Part II, we broke out the raw numbers by round selected, and then further sliced that data into an examination of “Top 10” and “Top 5” selections. Today we finish off the series by looking at draft selections by decade, hoping to see how things have trended over the entire era of the NBA Draft. See Table C below.

Table C. NBA Draft Picks by School & Decade (1949-2006)

Notes: this table is sorted by the Total Draftees column, and is limited to schools with a minimum of ten or more draft picks since 1949. The yellow shading refers to the highest number in that column.

NBA Draft Picks by Decade v.1

Observations:

Consistency. The first thing that struck us as interesting were the schools that were fairly consistent in providing draft picks throughout the NBA Draft era. UNC, Louisville, Kentucky and St. John’s do not lead any particular decade, but each school has provided at least two picks per decade throughout. UCLA and Indiana have been similarly consistent over the entire period, but each also led a decade in picks (UCLA during the 70s; Indiana during the 80s).

Less Volume, but Still Consistent. Look at Big 10 stalwarts Illinois and Minnesota, along with Villanova and Utah. We’ve been clowning the Gophers all week, but surprisingly, they’ve consistently produced between 2 to 7 picks per decade – guess it’s easy to forget about Willie Burton and Joel Przybilla. The same is true for the Illini (between 2 to 7 per decade), Villanova (2 to 5) and Utah (2 to 5). Maryland, Syracuse, Ohio St., Marquette, Wake Forest, Temple, USC, Stanford, Memphis, Tennessee, Oregon, BYU, Mississippi St., LaSalle and Bradley are some of the other schools with at least one draft pick per decade.

USF Dons

The USF Dons Represent a Bygone Era

Whatever happened to…? The University of San Francisco, led by KC Jones and Bill Russell, produced fourteen draft picks from 1949-79, and only two since. Eight of Kansas St.‘s fourteen total draft picks were produced from 1949-69, but there’s only been one since 1989 (Steve Henson in 1990) – it even led the 1940s/50s with seven picks. And despite its recent renaissance under John Beilein and the proliferation of draft picks to come under Bob Huggins, West Virginia has only had one draft pick since 1968 (seven overall)! Another early producer Holy Cross (six overall) hasn’t had any picks since 1969; and Grambling (nine overall) hasn’t had any since 1978.

Arizona & UConn

These Two Schools Have Come On Strong

Late Bloomers. The biggest examples of late bloomers have to be Arizona and Connecticut. Arizona’s first draft pick was in 1974, and it has produced thirty-three more since, good enough for sixth (tied with UK) all-time. Connecticut is even more shocking – the Huskies’ first pick was Cliff Robinson in 1989 (!!!), but it has produced twenty picks since (1.11 picks per year). Duke also has to be mentioned here. The Devils had good success in the early years (seven picks through the 70s), but have had thirty-two draft picks since 1980, twenty-six of those since 1990 (1.44 picks per year). They were second in the 90s with fifteen picks, and are currently tied with UConn leading the 2000s with eleven picks. No wonder they’ve been so good. Other late bloomers include Georgia Tech (22 of its 24 picks since 1982), Michigan St. (24 of its 26 picks since 1979), Georgetown (17 of 18 since 1980), Alabama (19 of 23 since 1982), Texas (15 of 17 since 1982), and Georgia (13 of 14 since 1982). After tonight’s draft, Florida could have as many as 14 of its 15 picks since 1984, but we already knew the Gators were a late bloomer. As a bit of an anomaly among the traditional powers, Kansas didn’t really begin consistent production of draft picks until the 70s (24 of 27 picks since 1972).

Coaches. The one trend we see with many of these late bloomers is how important coaches are to the talent level of a program. UNC, Louisville, UCLA, Kansas, Kentucky and Indiana have had great coaches throughout most of their histories. It makes sense that these schools have also been the most consistent at putting talent into the NBA Draft. But look at some of the other schools, particularly the late bloomers. Jim Calhoun has been responsible for every single one of UConn’s draft picks; Lute Olson has been responsible for all but five of Arizona’s draft picks (85%), and Coach K for 74% of Duke’s all-time picks. Bobby Cremins at Georgia Tech (79%), John Thompson at Georgetown (83%), and the Jud Heathcote/Tom Izzo reign at Michigan St. (92%) show just how important a single coach can be to a program.

Final Thoughts. This has been a fun experiment, and in only a few hours, we get to update all of our data with draft data from 2007. Something tells us that Florida and Ohio State’s numbers are going to be rising. Thanks to everyone for your thoughts and commentary. We now return to our regularly scheduled programming…

NBA Draft Picks by School Part II

Posted by rtmsf on June 27th, 2007

Thanks to everyone who took a few moments to look at our post from yesterday – NBA Draft Picks by School (1949-2006). There was an overwhelming response, and we appreciate all the commentary and advice, which is how we learn how to manage this thing a little better day-to-day.

First, let’s address a couple of the points we heard from you via email, msg boards and commentary.

  • The “modern draft” refers to the era in which the NBA began using a round-by-round system. Even though there was an NBA Draft in 1947 and 1948, the round system did not begin until 1949, which is why we decided to start there.
  • Following up on that point, we also chose to only review the first two rounds of the NBA Draft during this period. The current version (two rounds) began in 1989, and after a cursory review of the “extra” rounds – which totaled as many as twelve over this era, we realized very quickly that the vast majority of the players drafted in rounds 3+ never saw action in the NBA. For that reason, we decided to focus solely on the first two rounds.

Now, on with the data. We promised a breakdown by round and by decade, and we’ll deliver on half of that promise today. We also have sliced the first round into a “Top 10” and “Top 5” pick column, just for kicks. See Table B below.

Table B. NBA Draft Picks by School & Round Taken (1949-2006)

Notes: this table is sorted by the 1st Rd column, and is limited to schools with six first round picks since 1949. The yellow shading refers to the highest value in that column.

NBA Draft Picks by Round - 06 v.1

Observations:

Super Six. Remember what we were saying about the so-called Super Six yesterday? Well, these six schools – UNC, Duke, UCLA, Kentucky, Indiana and UCLA – take a larger piece of the action the higher up the draft board we go. They collectively comprise 13.4% (149 of 1115) of the all-time first-rounders, 14.8% of the top 10 picks (86 of 580), and 17.6% of the top 5 picks (51 of 290). In other words, more than a sixth of the top 5 picks in history came from one of the above six schools.

Jordan and Perkins

With Studs Like These, How do They Ever Lose?

Blue Heaven. The school with by far the most first-round picks, the most top 10 picks, and the most top 5 picks clearly resides in Chapel Hill. Let’s put this in perspective. UNC has had more top 5 picks than all but ten schools have had first round picks. It accounts for 6.2% of the top 5 picks in history all by itself, and dominates each of the above categories. That’s unbelievable. Nobody can ever say that Carolina hasn’t had a surplus of talent. Maybe that criticism of Dean Smith “only” winning two national titles at UNC has some legs after all.

Who doesn’t belong? Notre Dame, and again, Minnesota, seem to be the extreme outliers here. Was Digger Phelps really so bad of a coach that the Irish can produce twenty first-rounders (fifth on our list) and five top 5 picks but ND has only been to one F4 in its history? Guess so. We still can’t figure out Minnesota either. The Gophers are behind only UNC, Duke, UCLA and Kentucky in all-time top 10 picks. All we can guess is that Whitey Skoog, Ed Kalafat and Dick Garmaker must have been tremendous players back in the day. Also, a tip of the hat to Alabama and Missouri for producing a combined 27 first-rounders with nary a F4 to show for it. Nice work, gents.

Digger Phelps 2

Digger Must Have Been Even Worse as a Coach

We have a lot of good, but not great, players. The second round is always a fascinating hodgepodge of players who may have been fine collegians but were undersized, overslow or otherwise fraught with concerns about their transition to the League. Nothing says slow like Indiana, who coincidentally leads the way with 22 second round picks. Of course, Arizona follows up with 20 and UCLA with 19 second-rounders, so maybe that theory is a little half-baked. Nevertheless, it was cool to see the schools that consistently produce top talent vs. mediocre NBA talent (in the eyes of the GMs, at least). For UNC, it’s first round or bust, mostly (81% of its draftees went in the first round); for a school like LSU, either you’re drafted in the top 5 (8 of its 12 first-rounders) or you’re likely to end up in the second round (11 of the remaining 15 picks). One other neat example is Utah, where 9 of its 10 first-rounders went in the top 10 picks – maybe praying to Joe Smith (not the former Terp) or whatever it is that they do out there for a high NBA pick only works if you’re taller than 6’9 (e.g., Andrew Bogut, Keith Van Horn, Tom Chambers, Bill McGill).

Penn State Logo

Evidence that Penn St. Basketball Exists

Who is missing? Several schools with some solid history, including Marquette (5 first-rounders and 14 (!!) second-rounders), Pittsburgh (4/4), Xavier (4/6), Gonzaga (3/3) and UTEP (3/8), didn’t make our cut. Just for fun, the BCS schools with the least successful draft histories belong to… South Florida (only one second-rounder) and Penn State (two second-rounders). USF we understand – they’re new to the Big East and all – but Penn State? – that school has been in the Big 10 for almost fifteen years. That’s pathetic.

Coming Next: the final installment will take a look at draft picks by decade, so we can see how things have trended over the years. Which schools have consistently supplied talent to the NBA and which have long since passed or are rising fast? View Part III here.

NBA Draft Picks by School (1949-2006)

Posted by rtmsf on June 26th, 2007

We always believed that it would be cool if someone would take the time to break down the NBA Draft by schools since its inception, figuring there must be a loose correlation between the collegiate powers of the past sixty years and the players that the NBA finds draft-worthy. We’re not saying that a player is talented simply because he’s drafted by the NBA or that he sucks if he isn’t – rather, a player being drafted is solely an imperfect indicator that, at the time, a player’s collegiate career inspired professional scouts to believe that he could ultimately contribute to their team. But it’s also the only consistent indicator we have. To that end, we tried to determine if there was a rational way to determine how much “bang for your buck” having these talented soon-to-be NBA players on a college team’s roster matters over time.

Bang for Buck

We realize there are many ways to do this analysis and a number of these are meritorious, but for us, it always comes back to NCAA Tournament success – Appearances, Final Fours, Championships. These three measures show that you’re good enough to be invited, you’re good enough to go deep, and you’re good enough to win the title. So in looking at Table A below, you’ll see that the table is sorted by the schools with the most NBA Draft Picks in the first two rounds since 1949 (the first year of the “modern” NBA Draft), and each school also lists those three measures of success next to it (also since 1949). We considered here only the first two rounds of each draft for consistency and the likelihood of a player actually making the parent team.

Table A. NBA Draft Picks (first two rounds) From 1949-2006

Notes: this table is sorted by the NBA Draft Picks column and is limited to schools with a minimum of ten NBA Draft Picks since 1949. The yellow shading refers to the lowest ratio in that column; the light blue shading refers to the highest ratio in that column.

NBA Draft Picks by School - Ratios v.2

Observations.

Talent = Success. Out of the traditional Super Six schools – UCLA, UNC, Indiana, Duke, Kentucky and Kansas – each is among the top ten schools with the most NBA Draft picks. Collectively, these six schools have accounted for over 10% (231 of 2214) of the all-time NBA draft picks, which is fairly amazing if you consider that we’re discussing nearly sixty years worth of college basketball players and hundreds of programs.

Surprises. St. John’s, Maryland and Notre Dame are in the top fourteen of NBA draft picks with 32, 29 and 26, respectively, but their historic success as programs (two F4s each for SJU and Maryland, 1 F4 for ND) is definitely a bit lower than their talent over the years might suggest. They have had numerous good players, but it hasn’t translated into NCAA Tournament success at the same level as their contemporaries on this list. At the other end of the list, Florida‘s recent ascent into the elite company is not (yet) well-represented by its number of draft picks (only 10). However, we’d expect that to change very quickly, hitting as much as 15 after this year’s draft (Horford, Brewer, Noah, perhaps Green & Richard).

Golden gOh-fers. The biggest shocker of all deserves its own paragraph. Somehow the Minnesota Golden Gophers have managed to put 24 players into the NBA Draft over the years – only fifteen other programs have put more – yet nobody would mistake Minnesota for an elite program during any era, considering its paltry nine NCAA appearances and one F4. This disconnect is exhibited by the fact that Minnesota has the highest draft pick/NCAA appearance ratio among the schools listed. Fresno St. (thanks Tark) is the only other school with a ratio greater than 2.0. We think Long Beach St. also deserves a mention, not simply due to its high ratio (1.63), but also because it has produced more draft picks than many major conference teams despite never being much of a power, even within its own conference. On the flip side of things, it was also somewhat amazing to us that Arkansas had only produced fourteen NBA picks despite a substantial amount of NCAA success (26 appearances; 4 F4s; 1 title).

Goldy Gopher

Apparently These Three Gophers Were Drafted by the NBA

Team vs. Individuals. We’re going to be careful to avoid drawing too significant of a conclusion here, but we also found it interesting that among the top ten schools, only Kentucky and Kansas had draft pick/appearance ratios under 1.0, while the other eight schools were above that marker. We wonder out loud if this shows evidence of schools that have traditionally emphasized the team concept to make up for a lack of individual talent over the years; or if UK and KU are simply an anomaly among the most talented teams. There are probably too many variables at play here to make any supportable conclusion.

F4 & Title Ratios. Reviewing the draft pick/F4 ratios, only Indiana is the outlier here, as expected schools such as Kansas, UCLA, UNC, Duke and Kentucky (along with Florida) comprise the six lowest ratios. Considering only the schools with multiple F4 appearances, St. John’s and Maryland have the highest ratios of draft picks/F4s, showing again that they’re producing a lot of good players without as much success to show for it as the others near the top of the list. Along the same lines, considering only multiple titlists, Louisville, Kansas and Duke appear to be getting the least bang for the buck from its talent, as these three schools have the highest draft pick/title ratios among multiple titlists.

Coming Next: now that we’ve looked at the overall numbers, we’ll take a snapshot look at those numbers by decade and by round to see if anything else looks interesting. View Part II (by round) and Part III (by decade) here.

Fear Not, Fair Readers…

Posted by rtmsf on June 25th, 2007

We’re back from vacation.

The Shining

Wendy, I’m home!

Yes, we know you were waiting with baited breath for the next installment of our pithy commentary and analysis, but unlike certain charlatans working for large four-lettered sports news organizations, we don’t have enough friends (nor funds) to hire a guest blogger. Nor do we simply “forget” to finish posts, but that’s another issue for another time.

There’s a ton of things to get to, so for now, it’ll have to suffice with a simple agenda for the week. Here’s what’s coming:

  • Thursday night is the long-awaited 2007 NBA Draft, also known in common parlance as the Oden/Durant Sweepstakes. Everyone has an opinion on whom should be taken where, but we really don’t do projected drafts. What we will do, however, is take a look at the history of the NBA Draft through the prism of the many colleges that the players attended. Out of the more than two thousand players drafted in the first two rounds of the NBA Draft from 1949 to present, which schools are best represented? Who are the surprises and who are the disappointments? Which schools have trended up and down throughout the six decades of the draft? The first part of this snapshot analysis should roll out early this week and continue up through draft day.
  • We’re also nearly ready to introduce Part III of our NCAA Tournament Analysis, which will take a closer look at the raw numbers relating to the success of each conference during the 65 (64) team era. Building from this, Part IV will examine the conference overachievers and underachievers (assuming there are any), using a similar methodology to the one used for the schools themselves. Depending on how the NBA Draft material plays, these two posts should be coming out over the next week.
  • Finally, we’ll also try to find time to make some noise about some of the news that we’ve missed over the past week or so, including more of the coaching carousel, Indiana getting a new barn, and an NC State fan who told us over the weekend that “Sidney Lowe is going to be a beast.”

06.18.07 Fast Breaks

Posted by rtmsf on June 18th, 2007

With the draft withdrawal deadline looming…

  • Should I stay…  Cal’s DeVon Hardin, Marquette’s Dominic James, Nevada’s Marcelus Kemp, Illinois’ Shaun Pruitt, Texas A&M’s Joseph Jones and GW’s Maureece Rice will stick around another year to play for free.
  • Or should I go?  Georgetown’s Jeff Green, Georgia Tech’s Thaddeus Young, Nevada’s Ramon Sessions, Oklahoma State’s JamesOn Curry have all decided to keep their names in the draft.
  • In case you missed it, Florida guard Brandon Powell was arrested last week.
  • We thought this was kinda cool: Kareem‘s commencement speech at UCLA last weekend.

NCAA Tourney Overachievers and Underachievers of the 65 (64) Team Era

Posted by rtmsf on June 15th, 2007

We’ve received a resounding response on the post Tuesday evaluating school performance during the 65 (64) team era, so let’s waste no time in presenting Part II of our statistical profile of the NCAA Tournament during that period. As we alluded to in that post, looking at raw data in a vacuum has its limitations. From that data we got a reasonable sense of which programs have had the most success during the period, but it didn’t really give any insight as to which programs have overachieved, underachieved, or simply performed about as expected.

Ziggy

Which Schools Reach Their Potential?

Today’s post will address that issue. You might want to bookmark this page for next year’s bracket-filling, because we feel that what we’re showing today has significant value in determining those schools that tend to embrace expectations and those that tend to wither in the face of the red-hot lights of March. Stat geeks like ourselves should enjoy this post – hopefully it won’t bore the rest of you.

The first consideration in trying to determine which programs have overachieved and underachieved is how to answer that question. Traditionally, you often hear commentators and writers talk about “playing to your seed,” which essentially presumes that a #1 seed should make it to the Final Four, a #2 seed to the Elite Eight, and so on (see Table A below). Using this model, a team that wins any games beyond the expected wins of its seed would fairly be said to have overachieved as to the expectations of the seed (and vice versa).

Table A. Standard Model

NCAA EV by Seed (Presumed)

So let’s try to first answer that question using the Standard Model outlined in Table A. But don’t give up on the post after you review the Standard Model results, as we have another model below it that may bring up new and interesting considerations. The Standard Model as applied to the 65 (64) Team Era is Table B below.

Table B. Standard Model Applied to 65 (64) Team Era

Notes: the table is sorted by “+/- per App,” which represents the number of games won above or below the expected number of wins for that seed per NCAA appearance (1985-2007). The rows colored in green highlight schools that are in the top twelve spots of both Tables B and D. The rows colored in yellow highlight schools that are in the bottom twelve spots of both Tables B and D.

NCAA EV by Seed - Detailed v.3

Inside the Numbers (Table B):

Overachievers. What first jumps out at us using this method is just how (except Florida) there are no big names near the top of the list. Tulsa, Seton Hall, GW, UTEP, Temple? Without taking away from their performance – after all, every one of those teams should be commended for overperforming versus its seed – this immediately suggests to us that the Standard Model often used by the pundits actually favors lower-seeded teams who manage to win a game or two every couple of years in the NCAA Tournament. Using the schools above +0.30 as a natural break point, only Florida, Louisville and Temple have won more than twenty games in the NCAAs during this period, and the average seed of these thirteen schools was 7.0. Are these teams chronically underseeded or are they overachieving as a general rule? Whatever the case, we’re going to think a little harder about picking Tulsa the next time they make the bracket.

Tulsa Logo

Are the Golden Hurricanes the Biggest NCAA Tourney Overachievers?

Underachievers. A brief look at the names at the bottom of the list – Oklahoma, Cincinnati, Wake Forest, Stanford, Purdue, etc. – tells us that we’re on to something here. As our good buddy MK says, “Wake and Purdue can effin’ bite me. They kill my bracket every year.” Or something like that. Using -0.42 as a natural break, the eleven teams at the bottom averaged a seed of 4.8 during this period, which is a marginally better seed than the overachievers on this list. Oklahoma, Arizona and Illinois – what do you have to say for yourselves? Each of you has had at least 18 appearances during this era, averaged a solid if not spectacular seed between #4 and #5, and consistently played below that seed to the tune of -0.42 wins per appearance or worse. This matches Tuesday’s analysis with Oklahoma as a disappointment; but under this model, Arizona and Illinois (second tier elite performers on Tuesday) have some explaining to do.

Oklahoma celebration

You May Want to Avoid These Guys in your Brackets

You’ll See Them Again on the Long Road Back to the Middle. The Big Four from Tuesday – Duke, UNC, Kentucky and Kansas – find themselves in the middle of the pack. It’s notable that Duke averaged a seed of 2.32 during this era and still overachieved by +0.09 wins per appearance relative to seed. UNC and Kentucky are verrrry slightly underachieving, whereas KU’s recent vintage teams (2005 & 2006) probably contribute to its slightly lesser position at -0.23 wins per appearance. UConn should be lauded for overachieving at a clip of +0.14 wins per appearance, which somewhat mitigates their overall lack of F4s – they do win a lot of NCAA Tournament games. Syracuse, Georgia Tech, Memphis, Iowa St., California, Princeton and Notre Dame – all of these programs have played exactly to seed in the last 23 years. Be sure to remember that fact next year when filling out your brackets.

Criticism of the Standard Model. The primary problem with evaluating NCAA Tournament success based on “playing to the seed” is that it puts an unrealistic burden on highly-seeded teams because over time they never play to their seed. In the knockout crucible that makes the NCAA Tournament so exciting, a corollary result of using this criteria is that higher seeds (#1-#4) are largely set up to fail, and lower seeds (#9-#16) are significantly overachieving simply by winning one game. Additionally, we feel that using the Standard Model assumes too much at the squishy margins – that a #4 seed should win two games, a #5 seed should win only one game, and that a #8 seed should always beat a #9 seed – when both teams are probably very similar in ability. For this reason, we now offer an alternative model, one that considers actual historical performance of the seeds.

To that end, see Table C below for a historical snapshot of how well each seed actually performed in the 65 (64) team era.

Table C. Historical Model

NCAA EV by Seed - Historical

Considering Table C, we wanted to point out for a moment that we have a couple of thoughts. First, we found it interesting that #6 seeds have traditionally performed better than #5 seeds. This at first seems anathema to conventional wisdom, as a #6 likely has to get past a #3 in the second round, whereas a #5 must only defeat a #4. That is, until you remember that a #5 has the dreaded 5-12 match-up that knocks out so many higher-seeded teams (excepting 2007, of course). Also, it’s interesting that a #10 seed has a better historical expected number of wins than a #9 seed. This shows again that a better draw is to avoid the 8-9 match-up, even if you end up as a lower (but more likely to succeed) #10 seed.

Using the 1985-2007 Historical Model as a baseline expected value for each seed, our list of 64 schools is now featured in Table D below.

Table D. Historical Model Applied to 65 (64) Team Era

Notes: the table is sorted by “+/- per App,” which represents the number of games won above or below the expected number of wins for that seed per NCAA appearance (1985-2007). The rows colored in green highlight schools that are in the top twelve spots of both Tables B and D. The rows colored in yellow highlight schools that are in the bottom twelve spots of both Tables B and D.

NCAA EV by Seed - Hist Detailed 3

Notable Differences. Using the Historical Model, the first thing that strikes us as interesting is that many of the heavy hitters of the era have jumped considerably, including some all the way to the top of the list. In fact, the following schools – Kentucky, UNC, Duke, Kansas, UConn, UNLV, UCLA, Syracuse, Ohio St. – all rose at least fifteen places from where they were situated in Table B. Each of these schools (excluding Kansas and Ohio St.) have overachieved at least +0.25 wins per appearance above the historical performance of their seeds. Since these schools represent a total of thirteen championships and thirty-eight F4s during this era, the Historical Model viewpoint makes more sense than what the Standard Model shows.

Who Dropped? Creighton, George Washington, UAB and UTEP all went from nice-looking overachievers in Table B to slight underachievers using this model. NC State, Xavier and Gonzaga looked fantastic using the Standard Model, but look rather pedestrian using this one. The explanation for this is simple – these teams collectively averaged a #9 seed throughout this era – if we use the Basic Model, they should never win a game, so when they do, it looks as if they’re significantly overachieving. However, using the Historical Model, we see that they actually win NCAA Tournament games roughly commensurate with how a #9 seed typically performs. This again illustrates why we feel this model shows a truer snapshot of performance.

More Importantly, Who Stayed the Same? Now this is where it gets really interesting. The rows shaded in green in Tables B and D represent schools that were in the top twelve in playing beyond its seed using both models. You could accurately say that, no matter how you slice it, Florida, Seton Hall and Louisville are the truest overachievers of the 65 (64) team era. (Incidentally, Florida and Seton Hall are in the top four of both tables, with each school averaging an extra win beyond its seed for every two appearances in the NCAA Tournament.)  These three schools consistently play beyond the actual and historical expected value of the seed that the NCAA Selection Committee gives them.  

The rows shaded in yellow at the bottom of Tables B and D represent the true underachievers. These schools were in the bottom twelve in playing below its seed using both models. What’s peculiar about this statistic is that there appears to be a much greater correlation between the tables with respect to the underachievers than with the overachievers. Whereas the overachievers only had three common schools between the tables, regular NCAA disasters such as Georgia, Oklahoma, Stanford, Purdue, Wake Forest, Pittsburgh and St. John’s find themselves in both at the bottom looking up. If you are at all like us and believe that the weight of history contributes as a predictor of the future, then anyone reading this post should be extremely hesitant picking these schools to play beyond its seed to its seed in the Dance in the years going forward.

Chicken or the Egg

And Now, the Chicken/Egg Argument. Whether you buy into the Standard Model or the Historical Model or neither, we can say without a doubt that some schools appear to consistently overachieve relative to its seed, while others consistently underachieve relative to its seed. The question we want to posit to the readers is what causes this – is this simply a statistical anomaly? Are the overachievers regularly seeded too low by the NCAA committee; or, are the underachievers regularly seeded too high? Is there a self-fulfilling prophecy at work here, where schools that are known as chronic underachievers (ahem, Oklahoma) place so much pressure on themselves that they tighten up in the clutch? Conversely, do the overachievers find their wits amidst chaos to consistently come through under pressure because they are expected to do so? These are questions that we cannot answer, but we figure that there are elements of each at play here. We’d certainly like to hear your thoughts on this and any other topic. Oh, and apologies for the long post today.

Coming Next: We’ll take a look at the raw numbers again, but this time we’ll examine it by conference, which isn’t as easy as it sounds. Do you realize how many conference re-alignments and mergers and dissolutions there have been in the last 23 years of NCAA basketball?


Top NCAA Performers of the 65 (née 64) Team Era

Posted by rtmsf on June 12th, 2007

GMU Cartoon

Since there’s absolutely nothing going on this week, this is a good a time as any to start rolling out some of the data that we’ve been hoarding. First, a respectful tip of the hat goes to Florida Gator fan Louis Frank, who allowed us unbridled access to the detailed work in his NCAA Tournament database. Over the next week or so, we’re going to be presenting some descriptive statistics on the 64/65 team era of the NCAA Tournament sliced and diced in various ways.

Our first focus will be on individual team performance, viewed through the raw numbers and then with some analytical twists; then we’ll turn our attention to conference performance using the same parameters. The basic question we seek to answer is which teams and conferences tend to over- and underachieve in the NCAA Tournament since it expanded to 64 teams in the 1985 season? The reason we start with that somewhat arbitrary season is because from that point until now every championship team has had to win six games against seeded teams, with no exceptions. It also provides a tidy way of reviewing the data with a substantial sample of seasons – twenty-three – which also happens to coincide perfectly with the rise in popularity of NCAA basketball and the ESPN era.

NCAA Tournament Success (1985-2007)

Notes: the chart is sorted by winning percentage (minimum: 8 appearances) from 1985-2007. The green shaded rows represent schools that have won a national title during this period.

NCAA Tournament 1985-2007 v.3

Inside the Numbers:

Elite Eight. Of the 267 schools that have been invited to the NCAA Tournament during the last 23 years, the 64 listed above are the chronic repeat performers, each having made the Dance on at least eight occasions. Thirty-nine of those sixty-four have winning (> .500) records, but only a handful, eight, are elite (> .700 winning pct.). Suffice it to say that those eight elite programs account for 14 of the 23 (61%) national championships and 39 of the 92 (42%) Final Four teams during this era (programs with a national title are denoted above in green shading). These eight programs are: Duke, Connecticut, UNC, Kentucky, UNLV, Kansas, Florida and Michigan. Incidentally, Georgetown is the only school of the top 13 who did not have a title from 85-07, but dumb luck led to its 1984 title team being omitted from this list – apologies to the Hoyas.

Coach K b/w

You Have to Give the Devil His Due

The Krzyzewski Era. This era also neatly coincides with the rise of Duke as a basketball powerhouse – Coach K’s first Final Four was in 1986, and his string of success particularly from 1988-92 exceeds by itself almost every other school’s performance on this list. Duke has the most #1 seeds, the most Sweet 16 appearances, the most Final Four appearances, the most wins, the best winning percentage and the most national titles during this period. In several of those categories it leads by comfortable margins. We’ve made note that the current era of Duke basketball might be slipping a tad, but with numbers like the above to sustain, that may be an impossible task even for Krzyzewski. By these numbers, you’d have to go with North Carolina in second place and Kentucky a close third. Each has very similar statistics (appearances, #1 seeds, sweet 16s, titles, wins, winning pct.) in all but one category, Final Fours. Given the importance that the college basketball community places on reaching the final weekend, Carolina’s seven F4s to Kentucky’s four must trump, all else being relatively equal.

Traditional Powers. With Duke, UNC and Kentucky taking the top three spots by the raw numbers, how do the other three traditional powers of UCLA, Kansas and Indiana fare? Kansas is closest to the top group. The Jayhawks mirror UNC in many categories (including F4s), but its winning percentage is a little lower and it lacks that second national title that would vault it into the top three. UCLA experienced a couple of down periods during this era, but now appears to be on the rise again with two F4s in the past two seasons. Still, its top ten winning percentage (.667) and its national title in 1995 keep it in the second tier of performers over this era. Indiana has largely struggled since Bob Knight was forced out of Bloomington, but their consistency in making the tournament and winning a game or two (.604 winning pct.) – plus that national title in 1987 – probably keeps it in the second tier as well. There should be no question, though – if any of the traditional six powers were slipping in favor of one or more of the nouveaux riche, Indiana would be the choice here.

Bob Knight IU

IU is Showing post-Knight Slippage

Nouveaux Riche. Of the elites, Connecticut and Florida are clearly the party-crashers. Prior to 1985, UConn had four wins and Florida zero wins in the NCAA Tournament. Each now has two national titles and a winning percentage of greater than .700. The question is whether these programs will be sustainable whenever Calhoun and Donovan decide to move on (Calhoun, to retirement; Donovan, as Christine’s full-time house-b*tch). The 64/65 team era is already littered with similar riches-to-rags stories such as UNLV, which fell hard when Tarkanian was indicted retired; and, Michigan, who also dropped out of the college basketball landscape once the gravy train of athlete peddler Ed Martin ended. Arkansas is yet another example – all three programs have a national title and multiple F4s to its credit, but long periods of poor teams and inconsistency places them in the second tier of the era.

Others in Second Tier. Several programs were consistenty excellent over this era, but their numbers weren’t as eye-popping as some of the above schools. Syracuse, Michigan State, Maryland and Louisville all claim a title to go with multiple F4s. Who knew other than Orange fans that Jim Boeheim’s squad never claimed a #1 seed during this era – that seems hard to believe. True, though – Syracuse’s best seeds were five #2s – during the glory days of Pearl Washington, DC, Billy Owens and company – 1986, 1987, 1989, 1990, and 1991. It looked like Michigan State was ready to become a top tier program 6-8 years ago, and they still are an excellent one, but its winning percentage needs to improve a little more to reach that level.

Lute Olson

The Silver Fox has had his Ups and Downs

Whither Arizona? Arizona is the only school that was invited to the NCAA Tournament each year of this era. Yet Arizona’s success in the postseason leaves something to be desired for a program of its stature – multiple F4s and a title, but near the bottom of the championship-level schools in winning percentage. The Wildcats are a team to keep a watchful eye on when we present our over- and under-acheivers list later this week.

Rising Stars. Several programs to observe closely as we go deeper into this era are rising stars Georgetown, Ohio St., Memphis, Texas and Gonzaga. None yet has a title during this era, but each except Gonzaga has been to a F4, and all five are knocking on the door. These programs have the facilities and coaching in place to continue to rise up this list in the coming years.

Disappointments. Again, basing these observations on nothing more than raw numbers, you’d have to say that Oklahoma, Illinois, Purdue and Stanford have been the biggest disappointments. Collectively, these schools have had fourteen #1 seeds with only five F4s to show for it (obviously, zero titles as well). Although most of these programs have been consistently invited to the NCAA Tournament during this era, none has a winning percentage topping .600.

Quin Snyder Norm Stewart

What did these two do to Missouri?

Embarrassments. We’ll leave the mid-majors like Xavier alone here, but we wanted to save special mention for some of the BCS schools who have managed to get invited multiple times, but really didn’t do much when they got there. Georgia‘s one sweet sixteen in eight appearances and its .333 winning percentage doesn’t say much for a program that always seems to be rebuilding; Bob Knight’s Texas Tech doesn’t fare much better (two sweet sixteens). But the real winner of the most pathetic NCAA-caliber program award, in our estimation, has to belong to Missouri. The Tigers have been to the tournament fourteen different times during this era, even once as a #1 seed, and have only managed three sweet sixteen appearances, two elite eights and an overall losing record (.462). Serious congrats are in order for Norm Stewart and Quin Snyder. Mike Anderson has his work cut out for him. The saddest part is that Mizzou traditionally likens itself as a basketball school!

Ivy Sadness. The last word goes to Ivy stalwarts Penn and Princeton, two schools who show up every year (21 of the last 23 NCAA Tournaments) at the right time and venue, battle hard for about thirty minutes against a superior athletic opponent, then go back home and lick their wounds for another year after inevitably wearing down to the size and strength of its opponent. They may be a collective 3-21 (.125) in the Dance, but who will forget when they pull the big upsets, like Princeton 43, UCLA 41 (1996), or Penn 90, Nebraska 80 (1994). Ok, maybe beating Nebraska isn’t a big upset after all, but we still love the UCLA upset.

Coming Next: now that we’ve analyzed the raw numbers of the 64/65 team era of the NCAA Tournament, we’ll next be taking a look at the over- and under-achievers during the same period. After seeing the above, can you project who the best and worst will be? You might be surprised at some of the results.  View Overachievers and Underachievers here.