Robert Vaden Celebrates Faux POY Award With Public Intoxication Arrest

Posted by rtmsf on October 15th, 2008

It’s already been an exciting few days with Marcus Ginyard‘s and Terrence Williams‘ injuries and it only continues to get better as the news came out today that UAB sharpshooter Robert Vaden was arrested in Bloomington, Indiana, last weekend for public intoxication.  What was he doing there?  You may recall that Vaden was one of the IU players who followed Mike Davis to UAB after his dismissal from Indiana University in 2006.  After a scintillating junior campaign (21/4/3 assts) at UAB and a last-minute decision to come back to school for his senior season, Vaden is poised to have an all-american year for the Blazers. 

Or is he?

From the Birmingham News:

UAB basketball standout Robert Vaden was arrested on a preliminary charge of public intoxication last weekend while visiting friends in Bloomington, Ind.  The news comes on the same day that Conference USA coaches voted Vaden, a transfer from Indiana, as their Preseason Player of the Year.  The Bloomington Herald Times, which reported the story Tuesday, said Bloomington police Officer Ian Lovan saw a man who appeared intoxicated and was pushing people on a downtown Bloomington street. The man, later identified as the 23-year-old Vaden, failed dexterity tests to determine if he was drunk and was booked on the public intoxication charge, according to the newspaper.  Vaden is on probation after a disorderly conduct arrest in Birmingham in 2007. Vaden was one of five current or former UAB players arrested outside a Southside club in late August of last year.  

This could be extremely problematic for the fortunes of Mike Davis’ 2008-09 team, which is predicted to make a run at the CUSA title and an NCAA Tournament bid.  A PI is usually nothing to worry about, but getting a PI while on probation is potentially an entirely different matter.  Even just the arrest with no sticking PI charge could cause Vaden’s original charge of disorderly conduct to re-attach (including any possible jail time), depending on the moods of his probation officer and/or judge.  At minimum, we would expect even a Mike Davis player to merit a suspension of several games for this stunning lack of judgment. 

As for the news breaking on the same day that Vaden was awarded Preseason POY by the CUSA coaches, well, we just can’t help but think that somewhere a snivelling John Calipari had something to do with this.     

Share this story

Monday Wrap

Posted by rtmsf on February 25th, 2008

Since we just continue to get slammed by work and life in general, we can’t even find time to post new Erin Andrews pics (so a video will have to suffice today)… but here are a few things that we enjoyed from the weekend’s events.

#1 v. #2. This was the only game we got to see this weekend, but it looked a lot like we had expected. Seriously, who didn’t see this one coming after Memphis’ recent struggles? To paraphrase Luke Winn today, Memphis looks like the same team of athletes that they always have – a bunch of guys who can’t run a halfcourt offense or make a clutch foul shot under any circumstances. When John Calipari came onto PTI last week and said that his players traditionally were clutch at making FTs down the stretch, we almost fell off our chair in hysterics, considering the Tigers’ pathetic performance in the last five minutes of the game (1-8) last week at UAB. We still don’t love the Volz come March, but they seem to be a lot tougher mentally than the previous renditions. Major trap game upcoming for UT at Vandy on Tuesday night.

EA v. BP. What coach hasn’t been romantically linked to Erin Andrews at one time or another? After Saturday night’s halftime interview goosing at the hands of Bruce Pearl, we think it’s safe to say that EA isn’t busily canoodling with the Tennessee coach in her spare time. Ok!

Kelvin No More. So there was no player mutiny at IU over the weekend, but there may have been one on campus had the Hoosiers actually dropped their weekend game at Northwestern, currently winless (0-14) in the Big Ten. How will interim coach Dan Dakich handle what are obviously bruised player egos and emotions? The Hoosiers could be looking at a crash-and-burn in a big way here if he can’t get their buy-in very soon.

Other Games. A few other scores caught our eyes this weekend…

  • Oklahoma St. 61, Kansas 60. There is absolutely no excuse for KU losing to this OSU team.
  • Drake 71, Butler 64. Battle of the mid-majors involved Drake going to Hinkle and showing they’re going to be heard from in March.
  • Arizona 65, Washington St. 55. The strange and curious middle of the Pac-10 continues to confound us.
  • Miami (FL) 78, Maryland 63. Last week the Canes just made themselves relevant.
  • LSU 69, Ole Miss 49. Ok, so Andy Kennedy still had a good year in getting Ole Miss to the NIT.

Only four more days until March, people!!!

Share this story

Memp(h)is: Still #1

Posted by rtmsf on February 19th, 2008

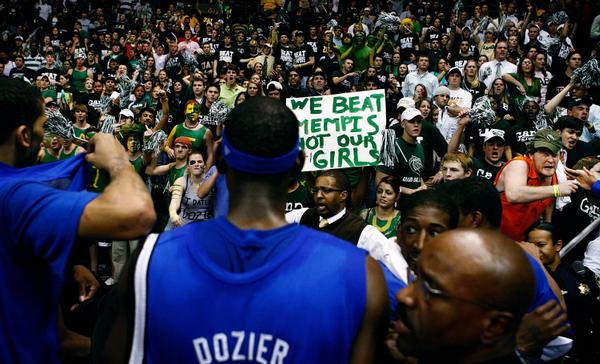
Great visual from the fracas after Memphis astonishingly grasped victory from the jaws of defeat at UAB on Saturday night…

Memphis v. UAB

We’re not sure which is funnier – the sign itself or the fact that UAB fans can’t spell the word “Memphis.” 

Helluva game though.  It appeared the Tigers’ unbeaten season was all but finished when UAB took a 77-70 lead with two minutes remaining.  But consecutive threes by Antonio Anderson and CDR combined with defensive stops led to the final play where CDR probably travelled and put Memphis ahead with an and-one basket. 

Why Memphis will not win the national title:  12-22 from the line, including 3-12 down the stretch as Memphis was trying in vain to make its comeback.  In fact, there were were two separate occasions in the last four minutes where Tiger players went to the line and missed BOTH free throw attempts.  Those are unbelievable momentum killers. 

For our money, Memphis appears complacent and flagging.  Is it the CUSA competition?  The pressure to stay unbeaten?  We’re going with Tennessee in the 1/2 matchup next weekend. 

Update:  These Guys did a much better analysis of the above photo than we ever could have.  Bama Bangs…  Bravo!

Share this story

Breaking Down the Preseason Mags… pt. 2

Posted by rtmsf on September 14th, 2007

So Wednesday we established that the Athlon Sports preseason magazine is one that you probably shouldn’t take home with you. Unless you’re the type of person who goes gaga over seeing your favorite team/player on the cover and must own them all in a Sisyphian quest to document every newsworthy event involving it throughout history. Consider this excitable Carolina fan’s tale we stumbled across today (re: the Athlon issue)…

Yep, arrived in Atlanta area stores last week, and every darn store I checked had the Georgia edition (one UGA player and one Ga Tech player on the cover). Same as last year. And the year before. Ad nauseum.

So I will do what I do every year – wait until all the mags are out, then drive up to visit my brother in NC and buy every mag with a Heel on the cover. That is always one of my most happy trips of the year.

Hey, we don’t judge. So here’s the second installment of our continuing series of reviews of the preseason magazines.

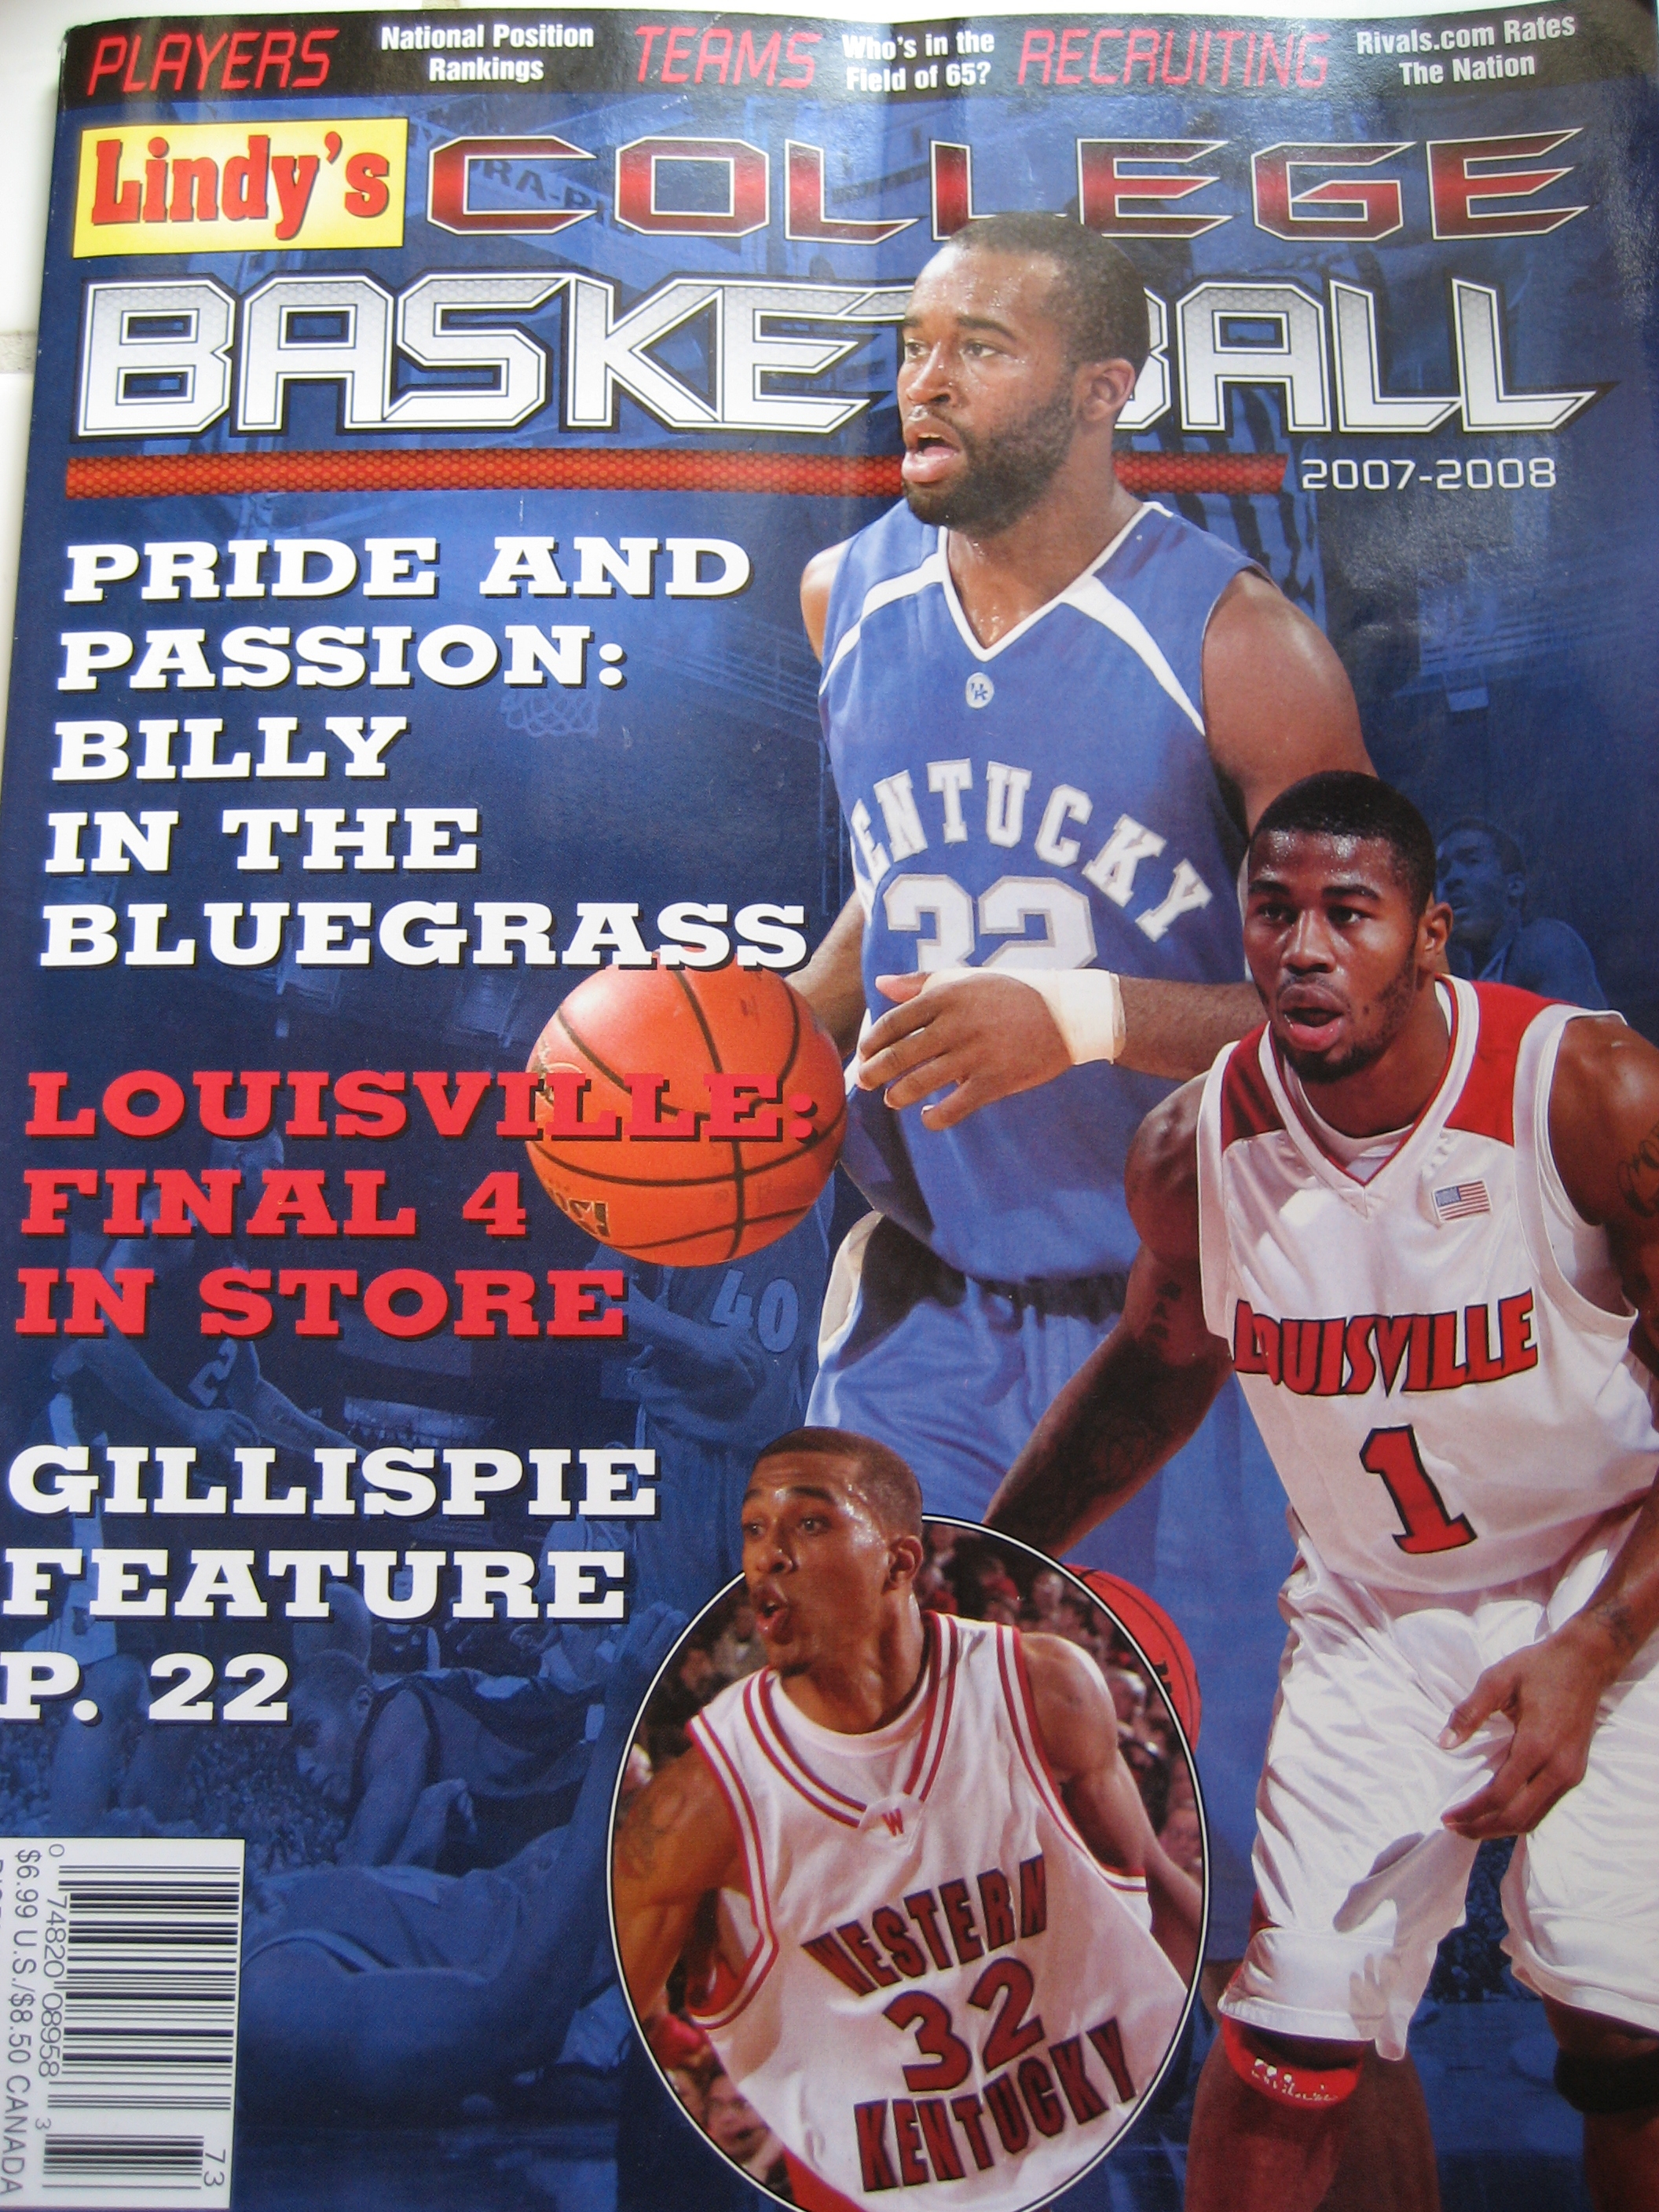
Next Up: Lindy’s.

Lindy’s


I. Covers (5 pts) – are they cool? inclusive?

  • 21 regional covers is a nice number, but the Rocky Mtn states aren’t represented in the least – Does Lindy’s realize that the Mountain West and WAC have fans too?
  • Coolest Cover – none – they’re pretty much all the same format, with multiple players photographically stacked on top of each other.
  • Say What? The Tennessee issue highlights UT, Memphis, Vandy and the Lady Vols?? The NE issue features UConn, BC and something called the “Lady Huskers,” which we assume is supposed to be “Huskies.” Either way, we have no tolerance for this.
  • Total Points = 2

II. Ease of Use (5 pts) – how hard is it to find confs/teams?

  • Somewhat difficult upon first glance. Eleven major conferences are arranged alphabetically, then by predicted order of finish of its teams. The rest of the conferences are shoved into the back of the mag with the teams arranged alphabetically within. Confusing.
  • Standard format otherwise – roundup, features & predictions; analysis of teams; recruiting, in that order.
  • Total Points = 2.5

III. Roundup (10 pts) – every mag has one – tell us something new!

  • Scoping the Nation dives into the one-and-done phenomenon, and pretty much makes the same assessment we made here back in May – that coaches at the elite programs recognize the necessity in assuming the risk of taking potential one-and-dones. The potential reward, as in the cases of Greg Oden and Mike Conley for Thad Matta at Ohio St., is simply too much to pass up. They also take a look at the ten most likely one-and-dones for this season and next.
  • The Nov/Dec Action to Check Out section is a bit of a copout by Lindy’s in the sense that its early publication resulted in not being able to review full schedules. Still, they make an attempt by reviewing the big pre-conference game possibilities in the holiday tournaments.
  • Lots of Lists – that’s ok, we like lists.
    • Top 10 “under the radar” players
    • Top 10 transfer players
    • Top 10 juco transfers
    • Top 10 jump shooters
    • Top 5 defenders
  • Lindy’s also provides a complete Top 25 (+15 fringe teams), a listing of the NCAA field of 65 by conference, as well as predictions of the Sweet 16 and Final Four.
  • There is also a complete list of coaching changes and the conferences are rated first (Pac-10) to worst (SWAC).
  • We also appreciated seeing deserving blurbs on Rick Majerus‘s return to college coaching at St. Louis, and Skip Prosser‘s passing at Wake.
  • They also rate the Top 25 players at each position…
    • PG – Drew Neitzel (Michigan St.)
    • SG – Chris Lofton (Tennessee)
    • SF – Brandon Rush (Kansas)
    • PF – Tyler Hansbrough (UNC)
    • C – Roy Hibbert (Georgetown)
  • …and the top frontcourt (UCLA) and backcourt (UNC).
  • Cool Stat Award. Utah St. guard Jaycee Carroll’s shooting numbers – .527 from the field, .432 on threes, and .888 from the foul line!
  • Total Points = 9

IV. Features (15 pts) – give us some insightful and unique storylines.

  • Kentucky-centric. Three of their feature articles relate to the UK head coaching position – Tubby’s leaving of the job (He’s Gone), Billy D’s courting of the job along with his about-face with Orlando (He Couldn’t Leave), and Gillispie’s acceptance of the job (Billy & the Believers).
  • What’s Good for the Zags… is a good article about the pressures that other mid-major programs (even the successful ones) now face in light of the Gonzaga Effect.
  • Embracing Kelvin is an insightful piece about the “my way or the highway” coaching style of Kelvin Sampson, and validates why we expect big things from IU this season.
  • Early and Often is a somewhat weaker article describing how coaches are faced with recruiting players earlier and earlier in high school (and sometimes back into junior high).
  • Total Points = 11

V. Predictions (20 pts) – how safe are their picks? do they take any chances? are they biased toward the big boys?

  • Lindy’s uses both the 65-team prediction model and the Top 25, as discussed above. Like Athlon, they too have UCLA defeating UNC in the final game, but we give them a little bit of credit for projecting first-timer Tennessee into the F4. They don’t predict an Elite Eight, but only half of their Sweet 16 made it there in 2007, which is realistic.
  • Big Conference Bias. Still, 14 of that Sweet 16 are from BCS conferences – Gonzaga and Memphis are the only exceptions. NCAA Bids – ACC (5), Big Ten (4), Big 12 (5), Big East (8), Pac-10 (7), SEC (7).
  • Mid-Major Watch. Mid-Major bids – 3 A10 (Xavier, St. Joe’s, St. Louis), 2 CAA (George Mason, VCU), 2 CUSA (Memphis, UAB), 1 Mountain West (BYU), 1 WAC (New Mexico St.), 1 MVC (S. Illinois).
  • Surprising Omissions. Florida loses everyone, but are there really seven better teams in the SEC this year? Billy D. has the #1 recruiting class coming into Gainesville. We also think Lorenzo Romar’s Washington squad is primed for a return to the NCAAs this year. Also, we gotta believe that the always-underrated MVC will manage to get another team in there, while seven (Georgia and Vandy??) from the SEC is a little ridiculous this year.
  • Boldest Prediction. Again, Lindy’s doesn’t go too far out on a limb with any of their picks, but Alabama winning the SEC West completely depends on Ronald Steele’s knees, and Cornell winning the Ivy League is also dubious.
  • Total Points = 14

VI. Conference Pages (5 pts) – as a primer for the conference, how much can we learn here?

  • The major and mid-major conferences get a predicted order of finish with brief analysis, a substantial recruiting roundup, three teams of all-conference selections, returning leaders in key categories, team stats and a fair superlatives section. While we appreciate a focus on acquainting readers with the newcomers, we would have liked to have seen less space used on this in favor of the returners.
  • The small conferences get a predicted order of finish, two teams of all-conference selections and a superlatives section.
  • Total Points = 3.5

VII. Team Pages (20 pts) – how in-depth is the analysis? where does it come from? is it timely and insightful given this year’s squad or is it just a rundown of last year’s achievements?

  • Lindy’s Top 40 teams get a full page of analysis, including player evaluations and team statistical rankings.
  • All other BCS and mid-major teams get a brief half-page of analysis with the same evaluations/rankings. Low major teams (even if predicted to make the NCAA Tourney) get a paragraph and a few key stats. Minimal info.
  • Again, similar to Athlon, analysis is lacking. Much of it is based on recapping last season’s accomplishments plus the obligatory coach’s quotes. For teams outside the Top 40, they barely get a mention.
  • Total Points = 12

VIII. Recruiting (5 pts) – we want to know who the top players are coming into college bball, where they’re going and who to watch for next year.

  • As mentioned above, each major conference page has a substantial section on newcomers and what their strengths and weaknesses are.
  • Six pages of recruiting information, featuring the top 25 recruiting classes with a brief description of each.
  • The top 50 of 2007 is provided by Rivals.com, but Lindy’s focuses on the future classes more than present, listing the top 100 for both 2008 and 2009, plus the top 10 for 2010.
  • They also provide some much-needed context and analysis from Justin Young at Rivals.
  • Total Points = 5

IX. Title IX Guilt (aka Chick Ball) (5 pts) – the less the better…

  • We already established that they’re putting some women’s players on the cover.
  • They also give it four pages in the front features section, with a detailed top 25 and fifteen All-Americans. Unacceptable.
  • Total Points = 1

X. Intangibles (15 pts) – what’s good and bad about the magazine as a whole?

  • Errors. We’re not sure if the cause is shoddy editing or what, but who and what are Reyshawn Green Terry (formerly of UNC) (p.9), David Lightly Lighty (Ohio St.) (p.18) and Gongzaga Gonzaga (p.28)? – these errors were found in the first few pages and seemed pervasive throughout, mitigating the mag’s credibility from the start.
  • Whereas Lindy’s provides far more interesting detail in almost every other area over Athlon, its writing (and clearly its editing) is weaker on the whole.
  • Again, no schedules due to the early publication date.
  • It takes some risks with its predictions (which we like), but its analysis really doesn’t explain why, e.g., Georgia is an NCAA Tournament team and Florida isn’t.
  • Total Points = 9

RTC Grade for Lindy’s = 69 pts

Basis: Lindy’s is a better magazine on the whole than Athlon, but it has serious weaknesses with respect to its team analyses. Where it excels is in the areas of roundup and recruiting information, but it needs better writing, editing and much more consideration of the smaller conferences. A little more attention to detail would make this magazine a legit value in future iterations.

Grading Scale:

  • 90-100 pts – exceptional quality in all areas – must buy and keep on-hand all season!
  • 80-89 pts – very good quality mag – worthy of purchasing and reading cover-to-cover
  • 70-79 pts – average, run of the mill magazine – some value in certain areas but weak in others – tough call as to whether to purchase it
  • 60-69 pts – magazine on the weaker side, but may still have some positive attributes – probably not worth the money, though
  • 0-59 pts – such a low quality magazine that it’s not worth any more than the five minutes you thumbed through it at the store
Share this story

09.11.07 Fast Breaks

Posted by rtmsf on September 11th, 2007

We’re so far behind in news that this is a must-post…

  • Huckleberry Hound Roy Williams and the entire 1966 Texas Western squad were the collegiate candidates inducted into the Basketball HOF on Friday.  No beef with the Glory Road fellas (although UK and Rupp’s ex post facto vilification is a story that still needs correcting), but has RW accomplished enough yet (five F4s, one title) to warrant inclusion?  Seems as if the committee jumped a little early on that one.
  • Come see the new inclusions in your town this fall, as the HOF is making a 30-city tour around the country over the next year.  The spokesperson of the tour is the Human Highlight Film himself. 
  • Stability in the Northeast – BC’s Al Skinner and Holy Cross’s Ralph Willard both had their contracts extended through 2013. 
  • Calipari mobilizes the entire city of Memphis to watch his players, who apparently cannot be trusted out on their own without inciting a freakin’ riot.  We knew before it even came out that The Mouth of the South, Joey Dorsey, would somehow be involved in this.  Make it rain, Joey.     
  • Not to be outdone, Mike Davis’s transfers at UAB decided to party without him, and all five were arrested on various charges.  The most disturbing in our eyes?  Walter Sharpe’s outstanding warrant for his arrest on a prior marijuana charge.  Not only did he already have a prior, but he didn’t even show up for the hearing?  And Davis didn’t know about this??  Now we know why IU fans wanted him gone.
  • Oh, and former Terp star and NCAA Champion Lonny Baxter has an unhealthy interest in firearms likes guns. 
  • From a while back, ESPN believes that nearly a third of D1 teams are eligible to become Bracket Busters.  (h/t to Awful Announcing)
  • Louisville’s new arena (due in 2010) is already bidding for future NCAA Tournament games.  Possible beneficiaries:  Kentucky, Indiana, Cincinnati, Xavier.   
  • Rivals weighs in with Alabama, Villanova, Illinois and others’ Labor Day weekend trips.  (takeaways:  Bama will struggle w/o Steele and Scottie Reynolds was on fire
  • Andy Katz also contributes with reports (here and here) of his trip to Mexico with OJ Mayo and USC.  (takeaway: OJ is the real deal)  
  • Goodman also has some summer excursion thoughts on Oklahoma, Duquesne, USC and Arkansas here; and Villanova, Marquette and James Madison here
  • Apparently Ohio St.’s Kosta Koufos was offered but did not take a Christian Drejer deal in Greece last week. 
  • Blue Ribbon’s preseason All-Americans are out – Drew Neitzel, Chris Lofton, Roy Hibbert, Tyler Hansbrough and Dominic James.  We’re lukewarm on Neitzel as a first-teamer. 
Share this story

NCAA Tourney Overachievers and Underachievers of the 65 (64) Team Era

Posted by rtmsf on June 15th, 2007

We’ve received a resounding response on the post Tuesday evaluating school performance during the 65 (64) team era, so let’s waste no time in presenting Part II of our statistical profile of the NCAA Tournament during that period. As we alluded to in that post, looking at raw data in a vacuum has its limitations. From that data we got a reasonable sense of which programs have had the most success during the period, but it didn’t really give any insight as to which programs have overachieved, underachieved, or simply performed about as expected.

Ziggy

Which Schools Reach Their Potential?

Today’s post will address that issue. You might want to bookmark this page for next year’s bracket-filling, because we feel that what we’re showing today has significant value in determining those schools that tend to embrace expectations and those that tend to wither in the face of the red-hot lights of March. Stat geeks like ourselves should enjoy this post – hopefully it won’t bore the rest of you.

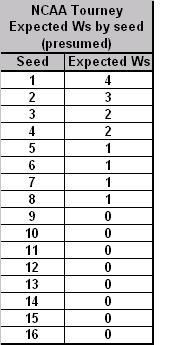
The first consideration in trying to determine which programs have overachieved and underachieved is how to answer that question. Traditionally, you often hear commentators and writers talk about “playing to your seed,” which essentially presumes that a #1 seed should make it to the Final Four, a #2 seed to the Elite Eight, and so on (see Table A below). Using this model, a team that wins any games beyond the expected wins of its seed would fairly be said to have overachieved as to the expectations of the seed (and vice versa).

Table A. Standard Model
NCAA EV by Seed (Presumed)

So let’s try to first answer that question using the Standard Model outlined in Table A. But don’t give up on the post after you review the Standard Model results, as we have another model below it that may bring up new and interesting considerations. The Standard Model as applied to the 65 (64) Team Era is Table B below.

Table B. Standard Model Applied to 65 (64) Team Era

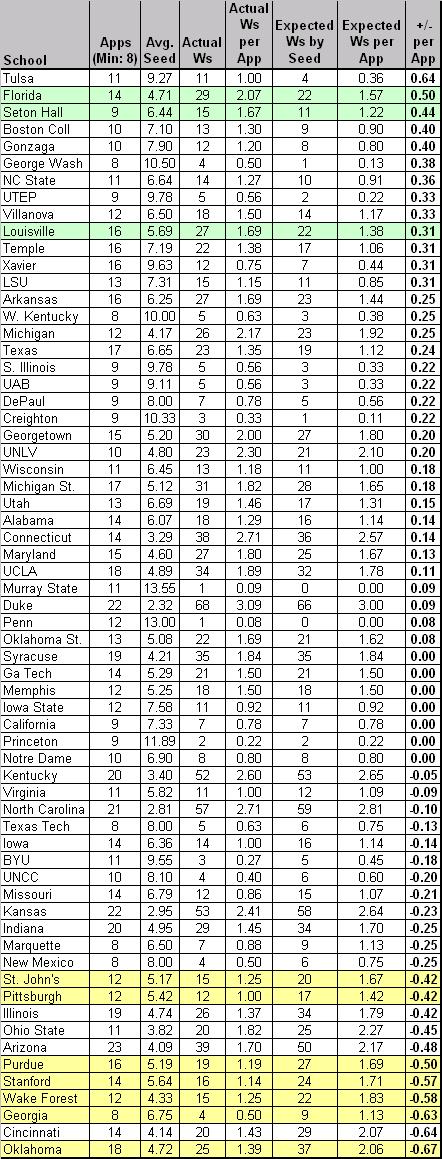
Notes: the table is sorted by “+/- per App,” which represents the number of games won above or below the expected number of wins for that seed per NCAA appearance (1985-2007). The rows colored in green highlight schools that are in the top twelve spots of both Tables B and D. The rows colored in yellow highlight schools that are in the bottom twelve spots of both Tables B and D.
NCAA EV by Seed - Detailed v.3

Inside the Numbers (Table B):

Overachievers. What first jumps out at us using this method is just how (except Florida) there are no big names near the top of the list. Tulsa, Seton Hall, GW, UTEP, Temple? Without taking away from their performance – after all, every one of those teams should be commended for overperforming versus its seed – this immediately suggests to us that the Standard Model often used by the pundits actually favors lower-seeded teams who manage to win a game or two every couple of years in the NCAA Tournament. Using the schools above +0.30 as a natural break point, only Florida, Louisville and Temple have won more than twenty games in the NCAAs during this period, and the average seed of these thirteen schools was 7.0. Are these teams chronically underseeded or are they overachieving as a general rule? Whatever the case, we’re going to think a little harder about picking Tulsa the next time they make the bracket.
Tulsa Logo

Are the Golden Hurricanes the Biggest NCAA Tourney Overachievers?

Underachievers. A brief look at the names at the bottom of the list – Oklahoma, Cincinnati, Wake Forest, Stanford, Purdue, etc. – tells us that we’re on to something here. As our good buddy MK says, “Wake and Purdue can effin’ bite me. They kill my bracket every year.” Or something like that. Using -0.42 as a natural break, the eleven teams at the bottom averaged a seed of 4.8 during this period, which is a marginally better seed than the overachievers on this list. Oklahoma, Arizona and Illinois – what do you have to say for yourselves? Each of you has had at least 18 appearances during this era, averaged a solid if not spectacular seed between #4 and #5, and consistently played below that seed to the tune of -0.42 wins per appearance or worse. This matches Tuesday’s analysis with Oklahoma as a disappointment; but under this model, Arizona and Illinois (second tier elite performers on Tuesday) have some explaining to do.

Oklahoma celebration

You May Want to Avoid These Guys in your Brackets

You’ll See Them Again on the Long Road Back to the Middle. The Big Four from Tuesday – Duke, UNC, Kentucky and Kansas – find themselves in the middle of the pack. It’s notable that Duke averaged a seed of 2.32 during this era and still overachieved by +0.09 wins per appearance relative to seed. UNC and Kentucky are verrrry slightly underachieving, whereas KU’s recent vintage teams (2005 & 2006) probably contribute to its slightly lesser position at -0.23 wins per appearance. UConn should be lauded for overachieving at a clip of +0.14 wins per appearance, which somewhat mitigates their overall lack of F4s – they do win a lot of NCAA Tournament games. Syracuse, Georgia Tech, Memphis, Iowa St., California, Princeton and Notre Dame – all of these programs have played exactly to seed in the last 23 years. Be sure to remember that fact next year when filling out your brackets.

Criticism of the Standard Model. The primary problem with evaluating NCAA Tournament success based on “playing to the seed” is that it puts an unrealistic burden on highly-seeded teams because over time they never play to their seed. In the knockout crucible that makes the NCAA Tournament so exciting, a corollary result of using this criteria is that higher seeds (#1-#4) are largely set up to fail, and lower seeds (#9-#16) are significantly overachieving simply by winning one game. Additionally, we feel that using the Standard Model assumes too much at the squishy margins – that a #4 seed should win two games, a #5 seed should win only one game, and that a #8 seed should always beat a #9 seed – when both teams are probably very similar in ability. For this reason, we now offer an alternative model, one that considers actual historical performance of the seeds.

To that end, see Table C below for a historical snapshot of how well each seed actually performed in the 65 (64) team era.

Table C. Historical Model
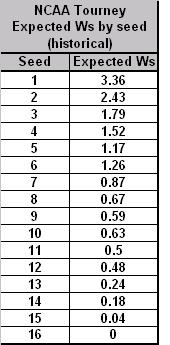
NCAA EV by Seed - Historical

Considering Table C, we wanted to point out for a moment that we have a couple of thoughts. First, we found it interesting that #6 seeds have traditionally performed better than #5 seeds. This at first seems anathema to conventional wisdom, as a #6 likely has to get past a #3 in the second round, whereas a #5 must only defeat a #4. That is, until you remember that a #5 has the dreaded 5-12 match-up that knocks out so many higher-seeded teams (excepting 2007, of course). Also, it’s interesting that a #10 seed has a better historical expected number of wins than a #9 seed. This shows again that a better draw is to avoid the 8-9 match-up, even if you end up as a lower (but more likely to succeed) #10 seed.

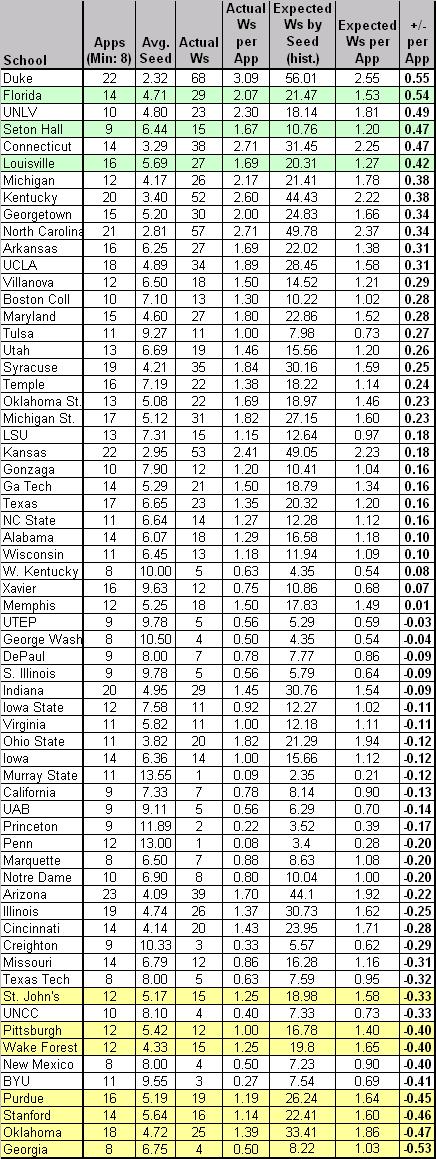
Using the 1985-2007 Historical Model as a baseline expected value for each seed, our list of 64 schools is now featured in Table D below.

Table D. Historical Model Applied to 65 (64) Team Era

Notes: the table is sorted by “+/- per App,” which represents the number of games won above or below the expected number of wins for that seed per NCAA appearance (1985-2007). The rows colored in green highlight schools that are in the top twelve spots of both Tables B and D. The rows colored in yellow highlight schools that are in the bottom twelve spots of both Tables B and D.
NCAA EV by Seed - Hist Detailed 3

Notable Differences. Using the Historical Model, the first thing that strikes us as interesting is that many of the heavy hitters of the era have jumped considerably, including some all the way to the top of the list. In fact, the following schools – Kentucky, UNC, Duke, Kansas, UConn, UNLV, UCLA, Syracuse, Ohio St. – all rose at least fifteen places from where they were situated in Table B. Each of these schools (excluding Kansas and Ohio St.) have overachieved at least +0.25 wins per appearance above the historical performance of their seeds. Since these schools represent a total of thirteen championships and thirty-eight F4s during this era, the Historical Model viewpoint makes more sense than what the Standard Model shows.

Who Dropped? Creighton, George Washington, UAB and UTEP all went from nice-looking overachievers in Table B to slight underachievers using this model. NC State, Xavier and Gonzaga looked fantastic using the Standard Model, but look rather pedestrian using this one. The explanation for this is simple – these teams collectively averaged a #9 seed throughout this era – if we use the Basic Model, they should never win a game, so when they do, it looks as if they’re significantly overachieving. However, using the Historical Model, we see that they actually win NCAA Tournament games roughly commensurate with how a #9 seed typically performs. This again illustrates why we feel this model shows a truer snapshot of performance.

More Importantly, Who Stayed the Same? Now this is where it gets really interesting. The rows shaded in green in Tables B and D represent schools that were in the top twelve in playing beyond its seed using both models. You could accurately say that, no matter how you slice it, Florida, Seton Hall and Louisville are the truest overachievers of the 65 (64) team era. (Incidentally, Florida and Seton Hall are in the top four of both tables, with each school averaging an extra win beyond its seed for every two appearances in the NCAA Tournament.)  These three schools consistently play beyond the actual and historical expected value of the seed that the NCAA Selection Committee gives them.  

The rows shaded in yellow at the bottom of Tables B and D represent the true underachievers. These schools were in the bottom twelve in playing below its seed using both models. What’s peculiar about this statistic is that there appears to be a much greater correlation between the tables with respect to the underachievers than with the overachievers. Whereas the overachievers only had three common schools between the tables, regular NCAA disasters such as Georgia, Oklahoma, Stanford, Purdue, Wake Forest, Pittsburgh and St. John’s find themselves in both at the bottom looking up. If you are at all like us and believe that the weight of history contributes as a predictor of the future, then anyone reading this post should be extremely hesitant picking these schools to play beyond its seed to its seed in the Dance in the years going forward.
Chicken or the Egg

And Now, the Chicken/Egg Argument. Whether you buy into the Standard Model or the Historical Model or neither, we can say without a doubt that some schools appear to consistently overachieve relative to its seed, while others consistently underachieve relative to its seed. The question we want to posit to the readers is what causes this – is this simply a statistical anomaly? Are the overachievers regularly seeded too low by the NCAA committee; or, are the underachievers regularly seeded too high? Is there a self-fulfilling prophecy at work here, where schools that are known as chronic underachievers (ahem, Oklahoma) place so much pressure on themselves that they tighten up in the clutch? Conversely, do the overachievers find their wits amidst chaos to consistently come through under pressure because they are expected to do so? These are questions that we cannot answer, but we figure that there are elements of each at play here. We’d certainly like to hear your thoughts on this and any other topic. Oh, and apologies for the long post today.

Coming Next: We’ll take a look at the raw numbers again, but this time we’ll examine it by conference, which isn’t as easy as it sounds. Do you realize how many conference re-alignments and mergers and dissolutions there have been in the last 23 years of NCAA basketball?


Share this story