Breaking Down the Preseason Mags… pt. 2

Posted by rtmsf on September 14th, 2007

So Wednesday we established that the Athlon Sports preseason magazine is one that you probably shouldn’t take home with you. Unless you’re the type of person who goes gaga over seeing your favorite team/player on the cover and must own them all in a Sisyphian quest to document every newsworthy event involving it throughout history. Consider this excitable Carolina fan’s tale we stumbled across today (re: the Athlon issue)…

Yep, arrived in Atlanta area stores last week, and every darn store I checked had the Georgia edition (one UGA player and one Ga Tech player on the cover). Same as last year. And the year before. Ad nauseum.

So I will do what I do every year – wait until all the mags are out, then drive up to visit my brother in NC and buy every mag with a Heel on the cover. That is always one of my most happy trips of the year.

Hey, we don’t judge. So here’s the second installment of our continuing series of reviews of the preseason magazines.

Next Up: Lindy’s.
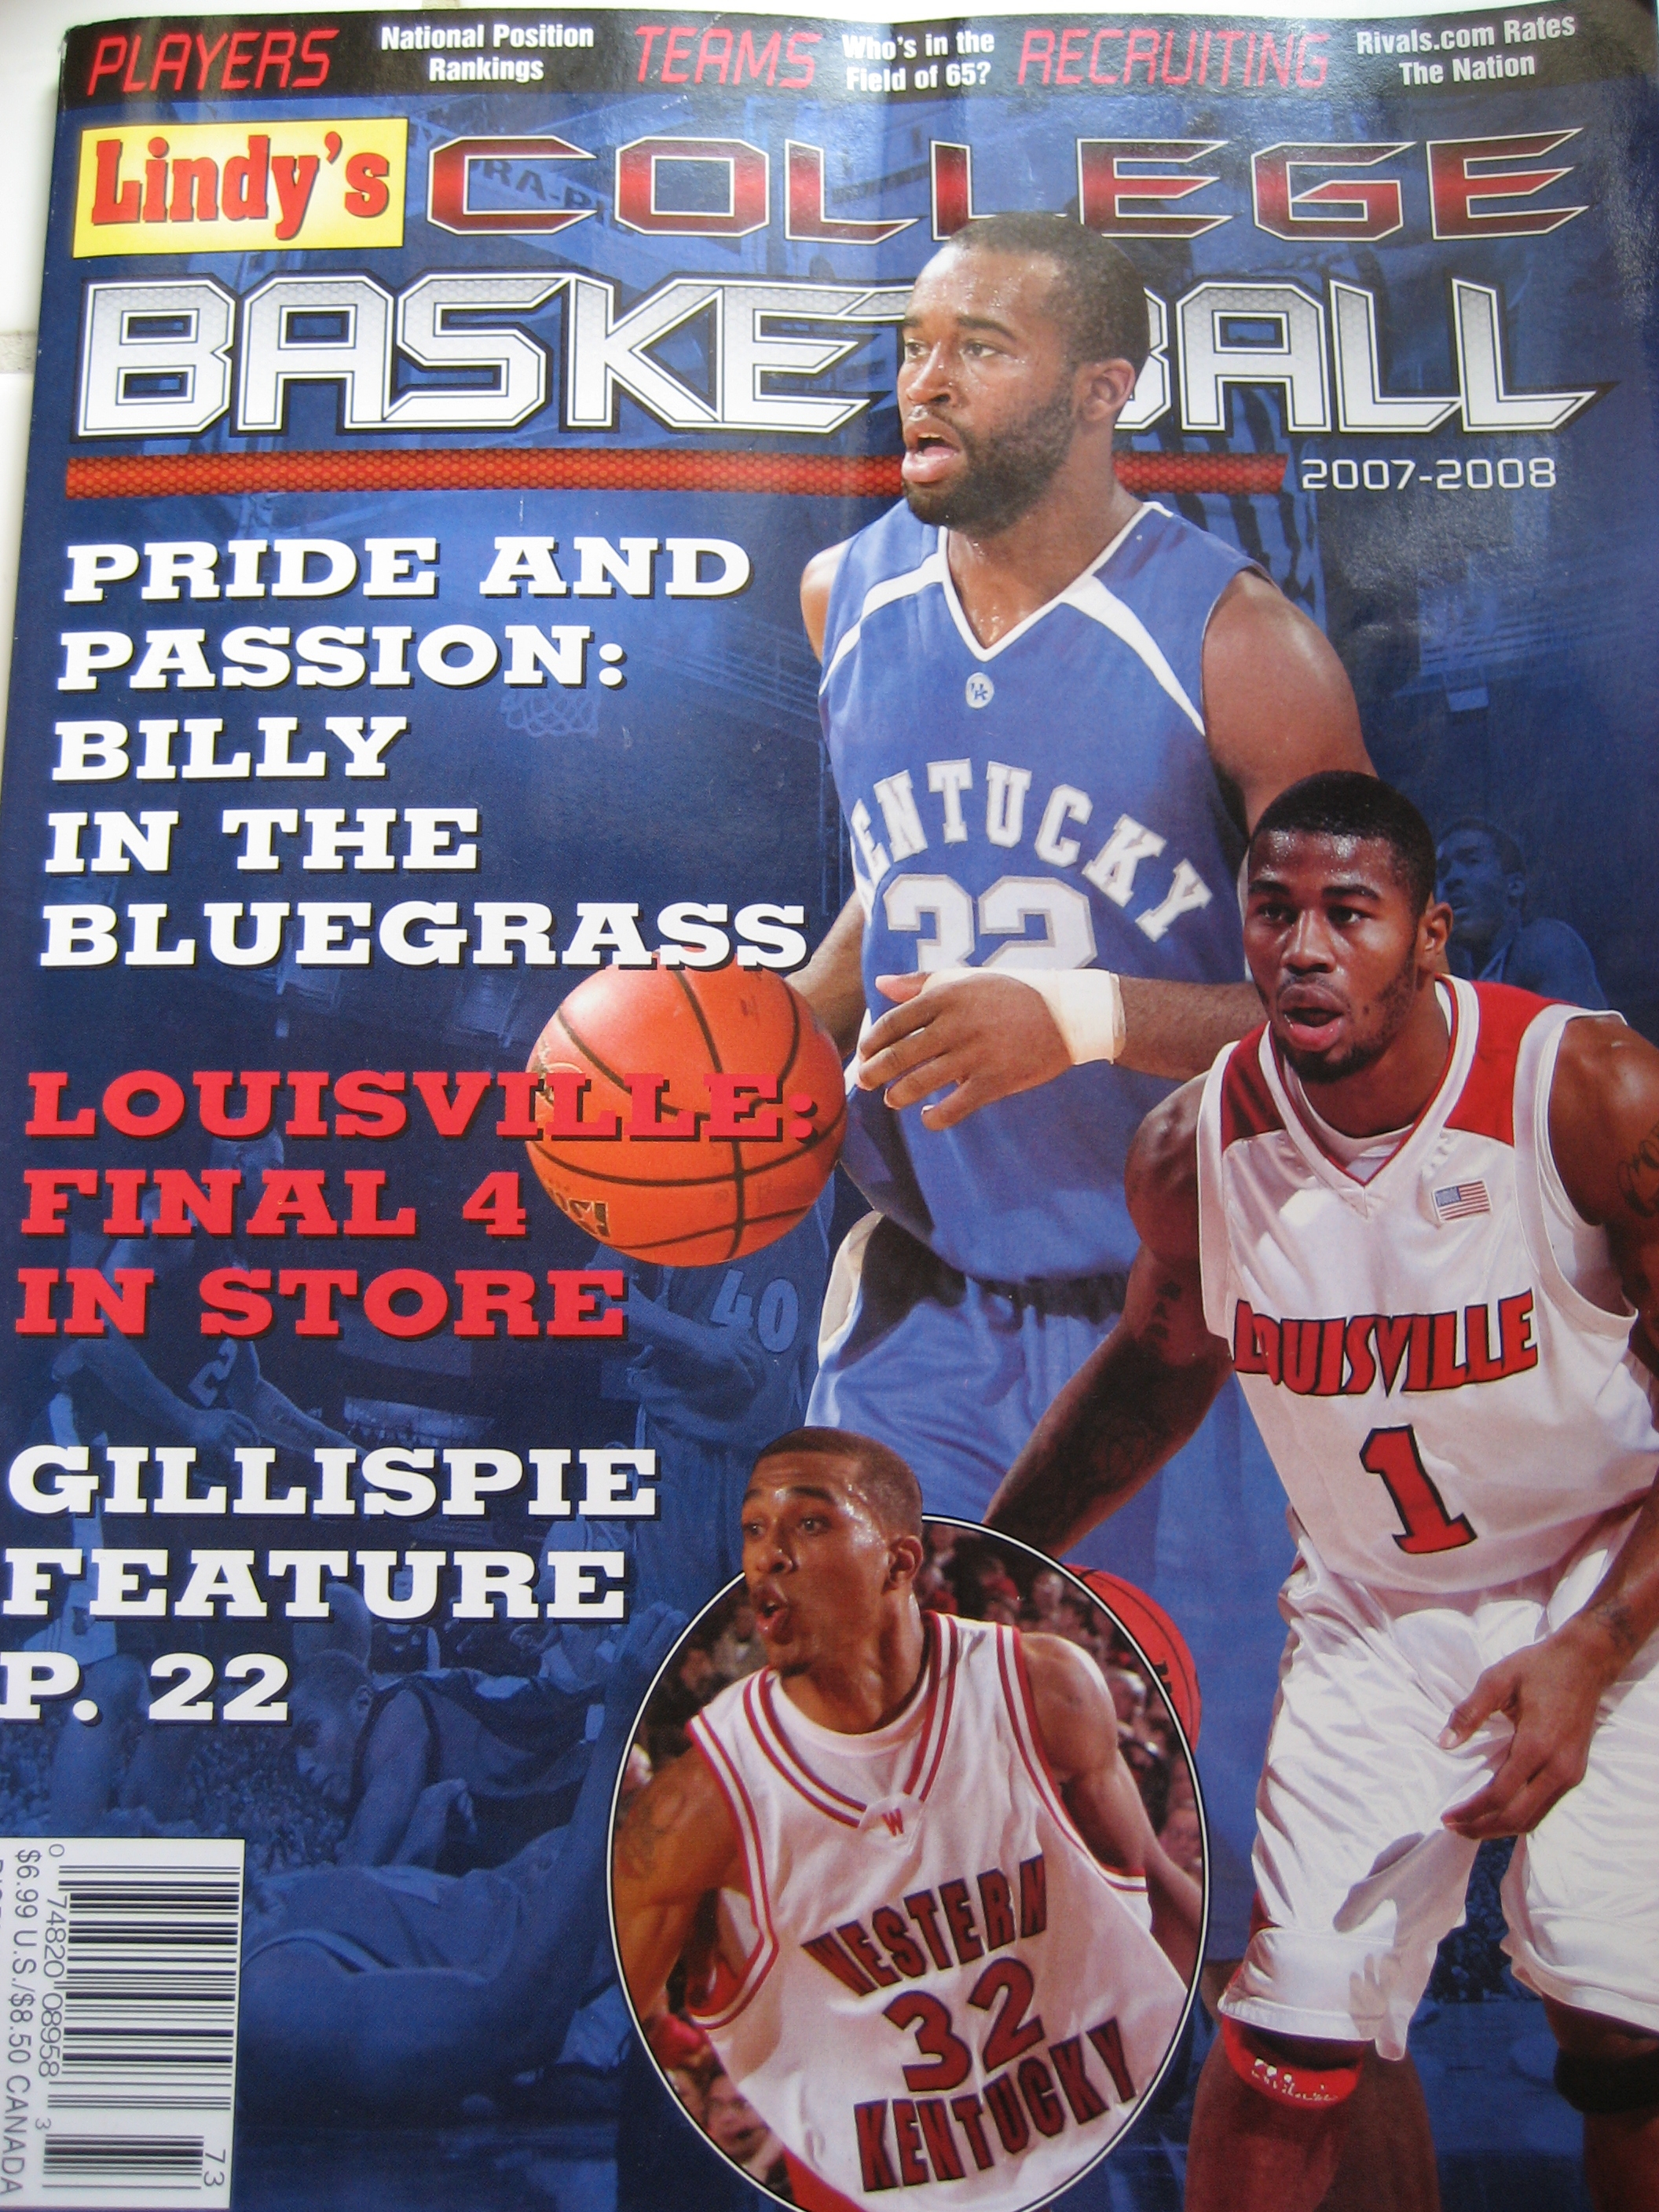
Lindy’s


I. Covers (5 pts) – are they cool? inclusive?

  • 21 regional covers is a nice number, but the Rocky Mtn states aren’t represented in the least – Does Lindy’s realize that the Mountain West and WAC have fans too?
  • Coolest Cover – none – they’re pretty much all the same format, with multiple players photographically stacked on top of each other.
  • Say What? The Tennessee issue highlights UT, Memphis, Vandy and the Lady Vols?? The NE issue features UConn, BC and something called the “Lady Huskers,” which we assume is supposed to be “Huskies.” Either way, we have no tolerance for this.
  • Total Points = 2

II. Ease of Use (5 pts) – how hard is it to find confs/teams?

  • Somewhat difficult upon first glance. Eleven major conferences are arranged alphabetically, then by predicted order of finish of its teams. The rest of the conferences are shoved into the back of the mag with the teams arranged alphabetically within. Confusing.
  • Standard format otherwise – roundup, features & predictions; analysis of teams; recruiting, in that order.
  • Total Points = 2.5

III. Roundup (10 pts) – every mag has one – tell us something new!

  • Scoping the Nation dives into the one-and-done phenomenon, and pretty much makes the same assessment we made here back in May – that coaches at the elite programs recognize the necessity in assuming the risk of taking potential one-and-dones. The potential reward, as in the cases of Greg Oden and Mike Conley for Thad Matta at Ohio St., is simply too much to pass up. They also take a look at the ten most likely one-and-dones for this season and next.
  • The Nov/Dec Action to Check Out section is a bit of a copout by Lindy’s in the sense that its early publication resulted in not being able to review full schedules. Still, they make an attempt by reviewing the big pre-conference game possibilities in the holiday tournaments.
  • Lots of Lists – that’s ok, we like lists.
    • Top 10 “under the radar” players
    • Top 10 transfer players
    • Top 10 juco transfers
    • Top 10 jump shooters
    • Top 5 defenders
  • Lindy’s also provides a complete Top 25 (+15 fringe teams), a listing of the NCAA field of 65 by conference, as well as predictions of the Sweet 16 and Final Four.
  • There is also a complete list of coaching changes and the conferences are rated first (Pac-10) to worst (SWAC).
  • We also appreciated seeing deserving blurbs on Rick Majerus‘s return to college coaching at St. Louis, and Skip Prosser‘s passing at Wake.
  • They also rate the Top 25 players at each position…
    • PG – Drew Neitzel (Michigan St.)
    • SG – Chris Lofton (Tennessee)
    • SF – Brandon Rush (Kansas)
    • PF – Tyler Hansbrough (UNC)
    • C – Roy Hibbert (Georgetown)
  • …and the top frontcourt (UCLA) and backcourt (UNC).
  • Cool Stat Award. Utah St. guard Jaycee Carroll’s shooting numbers – .527 from the field, .432 on threes, and .888 from the foul line!
  • Total Points = 9

IV. Features (15 pts) – give us some insightful and unique storylines.

  • Kentucky-centric. Three of their feature articles relate to the UK head coaching position – Tubby’s leaving of the job (He’s Gone), Billy D’s courting of the job along with his about-face with Orlando (He Couldn’t Leave), and Gillispie’s acceptance of the job (Billy & the Believers).
  • What’s Good for the Zags… is a good article about the pressures that other mid-major programs (even the successful ones) now face in light of the Gonzaga Effect.
  • Embracing Kelvin is an insightful piece about the “my way or the highway” coaching style of Kelvin Sampson, and validates why we expect big things from IU this season.
  • Early and Often is a somewhat weaker article describing how coaches are faced with recruiting players earlier and earlier in high school (and sometimes back into junior high).
  • Total Points = 11

V. Predictions (20 pts) – how safe are their picks? do they take any chances? are they biased toward the big boys?

  • Lindy’s uses both the 65-team prediction model and the Top 25, as discussed above. Like Athlon, they too have UCLA defeating UNC in the final game, but we give them a little bit of credit for projecting first-timer Tennessee into the F4. They don’t predict an Elite Eight, but only half of their Sweet 16 made it there in 2007, which is realistic.
  • Big Conference Bias. Still, 14 of that Sweet 16 are from BCS conferences – Gonzaga and Memphis are the only exceptions. NCAA Bids – ACC (5), Big Ten (4), Big 12 (5), Big East (8), Pac-10 (7), SEC (7).
  • Mid-Major Watch. Mid-Major bids – 3 A10 (Xavier, St. Joe’s, St. Louis), 2 CAA (George Mason, VCU), 2 CUSA (Memphis, UAB), 1 Mountain West (BYU), 1 WAC (New Mexico St.), 1 MVC (S. Illinois).
  • Surprising Omissions. Florida loses everyone, but are there really seven better teams in the SEC this year? Billy D. has the #1 recruiting class coming into Gainesville. We also think Lorenzo Romar’s Washington squad is primed for a return to the NCAAs this year. Also, we gotta believe that the always-underrated MVC will manage to get another team in there, while seven (Georgia and Vandy??) from the SEC is a little ridiculous this year.
  • Boldest Prediction. Again, Lindy’s doesn’t go too far out on a limb with any of their picks, but Alabama winning the SEC West completely depends on Ronald Steele’s knees, and Cornell winning the Ivy League is also dubious.
  • Total Points = 14

VI. Conference Pages (5 pts) – as a primer for the conference, how much can we learn here?

  • The major and mid-major conferences get a predicted order of finish with brief analysis, a substantial recruiting roundup, three teams of all-conference selections, returning leaders in key categories, team stats and a fair superlatives section. While we appreciate a focus on acquainting readers with the newcomers, we would have liked to have seen less space used on this in favor of the returners.
  • The small conferences get a predicted order of finish, two teams of all-conference selections and a superlatives section.
  • Total Points = 3.5

VII. Team Pages (20 pts) – how in-depth is the analysis? where does it come from? is it timely and insightful given this year’s squad or is it just a rundown of last year’s achievements?

  • Lindy’s Top 40 teams get a full page of analysis, including player evaluations and team statistical rankings.
  • All other BCS and mid-major teams get a brief half-page of analysis with the same evaluations/rankings. Low major teams (even if predicted to make the NCAA Tourney) get a paragraph and a few key stats. Minimal info.
  • Again, similar to Athlon, analysis is lacking. Much of it is based on recapping last season’s accomplishments plus the obligatory coach’s quotes. For teams outside the Top 40, they barely get a mention.
  • Total Points = 12

VIII. Recruiting (5 pts) – we want to know who the top players are coming into college bball, where they’re going and who to watch for next year.

  • As mentioned above, each major conference page has a substantial section on newcomers and what their strengths and weaknesses are.
  • Six pages of recruiting information, featuring the top 25 recruiting classes with a brief description of each.
  • The top 50 of 2007 is provided by Rivals.com, but Lindy’s focuses on the future classes more than present, listing the top 100 for both 2008 and 2009, plus the top 10 for 2010.
  • They also provide some much-needed context and analysis from Justin Young at Rivals.
  • Total Points = 5

IX. Title IX Guilt (aka Chick Ball) (5 pts) – the less the better…

  • We already established that they’re putting some women’s players on the cover.
  • They also give it four pages in the front features section, with a detailed top 25 and fifteen All-Americans. Unacceptable.
  • Total Points = 1

X. Intangibles (15 pts) – what’s good and bad about the magazine as a whole?

  • Errors. We’re not sure if the cause is shoddy editing or what, but who and what are Reyshawn Green Terry (formerly of UNC) (p.9), David Lightly Lighty (Ohio St.) (p.18) and Gongzaga Gonzaga (p.28)? – these errors were found in the first few pages and seemed pervasive throughout, mitigating the mag’s credibility from the start.
  • Whereas Lindy’s provides far more interesting detail in almost every other area over Athlon, its writing (and clearly its editing) is weaker on the whole.
  • Again, no schedules due to the early publication date.
  • It takes some risks with its predictions (which we like), but its analysis really doesn’t explain why, e.g., Georgia is an NCAA Tournament team and Florida isn’t.
  • Total Points = 9

RTC Grade for Lindy’s = 69 pts

Basis: Lindy’s is a better magazine on the whole than Athlon, but it has serious weaknesses with respect to its team analyses. Where it excels is in the areas of roundup and recruiting information, but it needs better writing, editing and much more consideration of the smaller conferences. A little more attention to detail would make this magazine a legit value in future iterations.

Grading Scale:

  • 90-100 pts – exceptional quality in all areas – must buy and keep on-hand all season!
  • 80-89 pts – very good quality mag – worthy of purchasing and reading cover-to-cover
  • 70-79 pts – average, run of the mill magazine – some value in certain areas but weak in others – tough call as to whether to purchase it
  • 60-69 pts – magazine on the weaker side, but may still have some positive attributes – probably not worth the money, though
  • 0-59 pts – such a low quality magazine that it’s not worth any more than the five minutes you thumbed through it at the store
Share this story

Breaking Down the Preseason Mags…

Posted by rtmsf on September 12th, 2007

We’re heading into the middle of September already, literally thirty days until Midnight Madness, and the first batch of preseason mags are already proliferating on B&N shelves like West Virginians on crystal meth at a swap meet (no offense intended to the West Virginians not on crystal meth, of course). We know many of our readers are asking, “what’s a magazine?” To which we reply, “it’s what old people read while they’re on the toilet.” For our few readers here over 30 (present company excluded), we offer the first installment of our continuing series of reviews of the preseason magazines.

First in line: Athlon Sports.

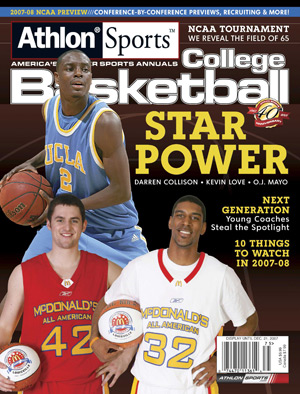
Athlon Preseason Cover 07

I. Covers (5 pts) – are they cool? inclusive?

  • 34 regional covers seems like overkill, but we suppose having a Minnesota/Iowa/Iowa St. cover matters to someone.
  • Coolest Cover – for some reason, we particularly like the elated yet menacing look Patrick Beverly gives the camera on the Arkansas edition.
  • Say What? Athlon’s UCLA/USC cover (above) features Kevin Love and OJ Mayo in their Burger Boy unis – was it really too much trouble to shoot them with their correct jerseys on?
  • Total Points = 4

II. Ease of Use (5 pts) – how hard is it to find confs/teams?

  • Conferences and teams are arranged alphabetically, allowing for quick navigation assuming you know your conference.
  • Standard format otherwise – features & predictions; analysis of teams; recruiting, in that order.
  • Total Points = 4

III. Roundup (10 pts) – every mag has one – tell us something new!

  • 10 Things to Watch is ok, but we didn’t learn anything new (i.e., the Pac-10 is great, keep an eye on Love/Mayo/Gordon, etc.).
  • Hoops Madness is a little better, mostly because of its lists of emerging stars (hot sophs to watch), top transfers and coaches on the hot seat. Also enjoyed learning that Dayton’s band has become the band by proxy for the Niagara Purple Aces (since NU doesn’t have one).
  • Cool Stat Award. Memo to Adam Lonon (VMI) – shoot more! (31 starts, 26 FGs)
  • Total Points = 5

IV. Features (15 pts) – give us some insightful and unique storylines.

  • Next Generation is a decent article about the young brigade of coaches who have been successful so far (Donovan, Matta, JT3, Howland, etc.). It wasn’t unique, as we expect to see a lot of this in the rags this year.
  • The Fix relates the story of the Tulane pointshaving scandal two decades ago. Although the article briefly mentions the Tim Donaghy story, it focuses primarily (and misguidedly) on the people involved in the scandal. What we needed to see here was an article about the existence of gambling among college athletes and efforts to prevent it. Big swing & miss here.
  • The Scoop is three one-page interviews with Ronald Steele (Alabama), Bill Walker (Kansas St.) and Drew Neitzel (Michigan St.), none of which are very interesting.
  • Total Points = 5

V. Predictions (20 pts) – how safe are their picks? do they take any chances? are they biased toward the big boys?

  • Athlon uses the 65-team prediction model, eschewing the traditional Top 25 (they get pts for that). But Athlon goes waaaaaaaaay safe by predicting six of the elite eight the same as 2007 (Georgetown, Kansas, Memphis, UNC, Oregon, UCLA with Louisville and Tennessee added for good measure). UCLA defeats Carolina in the championship.
  • Big Conference Bias. 15 of its Sweet 16 are from BCS conferences – highly doubtful and incredibly LAME! NCAA Bids – ACC (5), Big Ten (5), Big 12 (5), Big East (9), Pac-10 (7), SEC (6).
  • Mid-Major Watch. Only Memphis from a mid-major conference (CUSA) into the Sweet 16. Mid-Major bids – 2 CAA (George Mason, VCU), 2 MVC (Bradley, S. Illinois), 1 A10 (Xavier), 1 Mountain West (BYU), 1 WAC (Nevada). We’ll bet anything Athlon’s editors choose that those six conferences will get more than eight bids next March.
  • All-Americans. Athlon really likes Drew Neitzel for some reason. He joins Psycho T, Chris Lofton, Roy Hibbert and Darren Collison (?) on their first team. They took a big flier on putting oft-injured Ronald Steele on the third team.
  • Boldest Prediction. It’s sad that we had to dig this deep to find it, but it’s probably their pick for Cornell to win the Ivy League over Penn & Princeton. The last time a team other than those two won the Ivy Championship was in 1988 with (guess who?) Cornell.
  • Total Points = 10

VI. Conference Pages (5 pts) – as a primer for the conference, how much can we learn here?

  • The major conferences get a predicted order of finish, a brief recruiting roundup, and three teams of all-conference selections plus a “superlatives” section, which is fairly weak compared to others we’ve seen (POY, DPOY, most underrated, newcomer).
  • The mid-major and small conferences only get a predicted order of finish, one team of all-conference selections and an all-time NCAA Tourney stat for the conference (which is interesting).
  • Total Points = 2.5

VII. Team Pages (20 pts) – how in-depth is the analysis? where does it come from? is it timely and insightful given this year’s squad or is it just a rundown of last year’s achievements?

  • All major conference and projected mid-major NCAA Tournament teams get a full page of analysis, including evaluations of the frontcourt and backcourt as well as a team roster (w/ stats) and a team-oriented stat.
  • Non-NCAA Tournament mid-majors and low majors get at most a half-page analysis and roster, but most only get a paragraph with a very brief synopsis.
  • Clearly much of the analysis is based on what coach’s interviews, which results in analyses from “glass half full” perspective. We would have liked to have seen more contrarian viewpoints.
  • The depth of analysis is solid if not spectacular for the major conference teams, but largely lacking for the others.
  • Total Points = 14

VIII. Recruiting (5 pts) – we want to know who the top players are coming into college bball, where they’re going and who to watch for next year.

  • Four pages of recruiting information, including the top 100 (Scout.com) of 2007, the next 200 players, and the top 20 by position. Solid raw data.
  • It also includes the top 25 classes, but only as a list, with no additional details.
  • The top 100 in the class of 2008, top 25 in 2009 and top 10 in 2010 are also listed.
  • Total Points = 3

IX. Title IX Guilt (aka Chick Ball) (5 pts) – the less the better…

  • Only two pages worth, and at the very back of the magazine.
  • Total Points = 5

X. Intangibles (15 pts) – what’s good and bad about the magazine as a whole?

  • In the past, Athlon’s mag hasn’t always looked as professional as some of the others. This is no longer the case. Its layout looks great, the photos and graphics are solid, and the writing has improved.
  • Because it comes out so early, the advantage it gains in being one of the first published is mitigated by other temporal factors. Most notably, there are no schedules within the magazine – for that reason alone, Athlon cannot be your “go-to” preview issue during the season.
  • Additionally, its early publish date means that it misses late summer news involving injuries, transfers and coaching changes. While they did get the Skip Prosser news in there, they did not, for example, consider how Andy Rautins’ knee injury will impact Syracuse.
  • As a nontraditional magazine (i.e., not Street & Smith or TSN), Athlon should have taken more risks with their predictions – going all chalk won’t separate it from the pack.
  • Total Points = 8

RTC Grade for Athlon = 60.5 pts

Basis: Athlon is on the lower side of quality with the preseason magazines, but they have gotten better, and there is some value in their analysis. Its best use (given its early arrival on the newstand) is simply to refamiliarize yourself with the names and faces of the upcoming season. We wouldn’t recognize purchasing it unless you simply cannot wait for the better ones to come out.

Grading Scale:

  • 90-100 pts – exceptional quality in all areas – must buy and keep on-hand all season!
  • 80-89 pts – very good quality mag – worthy of purchasing and reading cover-to-cover
  • 70-79 pts – average, run of the mill magazine – some value in certain areas but weak in others – tough call as to whether to purchase it
  • 60-69 pts – magazine on the weaker side, but may still have some positive attributes – probably not worth the money, though
  • 0-59 pts – such a low quality magazine that it’s not worth any more than the five minutes you thumbed through it at the store
Share this story

2007 Athlademic Ratings – Revised

Posted by rtmsf on September 5th, 2007

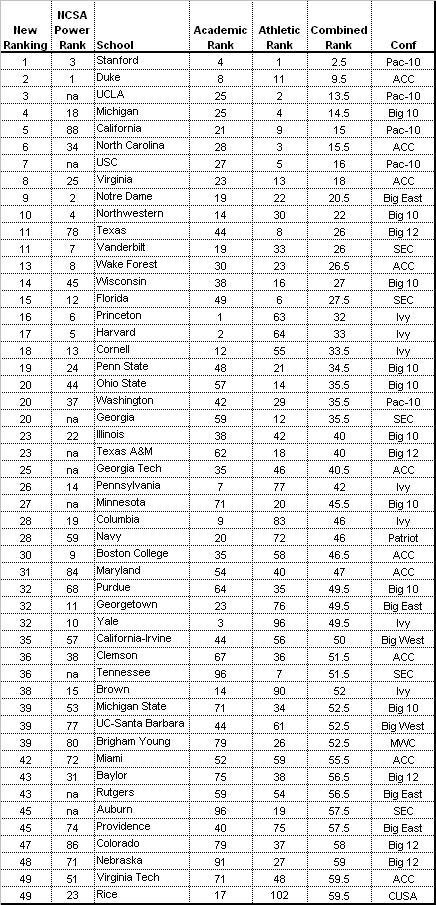
Ok, so thanks to an insightful UCLA fan, we realized that our exuberant reliance on NCSA data to justify our Athlademic Rankings posted last week was giving them way too much credit for properly vetting their data.  So to make sure we get it right this time, we spent the better part of today going through the 2007-08 US News rankings and the 2006-07 Sears Cup rankings ourselves.  Here’s the revised list, in Table A

Table A.  Athlademic Ratings – Division I (revised)

NCSA Revised Rankings

New Arrivals.  In addition to UCLA and USC, we also see the inclusion of Georgia, Texas A&M, Georgia Tech, Minnesota, Tennessee, Rutgers and Auburn onto our list – all driven by strong athletic programs.  High academic schools with relatively weak athletic programs, such as Army, William & Mary and Dartmouth, fell out of the top 50 due to the addition of the above programs. 

Ivy League logo

The Ivies strike a Nice Balance in Athlademics 

Ivy League Balance.   Speaking of Dartmouth, Keggy the Keg and friends are the only Ivy League school that didn’t make our Top 50.  The other seven did, with Princeton (no surprise there) leading the way at #16 overall.  Granted, the high academics of the schools drives their inclusion here, but we shouldn’t discount that these schools rate above many larger BCS schools in terms of the success of its athletic programs.  Cornell has the 55th most successful athletic program, but there are 73 BCS schools, which means Cornell, Princeton (#63) and Harvard‘s (#64) athletic programs  are outperforming bigger state schools such as Kansas (#66), Iowa (#68), and Connecticut (#82).

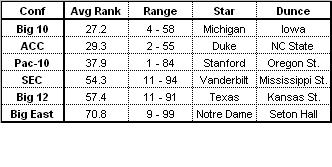
Big 10 – ACC Challenge.    As in, the Big 10 and ACC challenge the rest of the BCS conferences to keep up with it when it comes to athlademics.  We rated all 73 BCS conference schools, keeping those ahead of them in place, and Table B below shows the results. 

Table B.  BCS Conference Athlademic Ratings

 Conf Ratings

Why is the Big East so bad?  There’s a pretty clear top tier of Big 10, ACC and Pac-10, a middle tier of the SEC and Big 12, and a bottom tier, where the Big East lurks like Gollum all by itself.  The Big East really gets killed on both sides of the equation – it has seven (of 16) third-tier academic schools, as rated by US News (more than the other 5 conferences combined); and seven schools that finished outside of the top 100 in the Sears Cup (Mississippi St. and Kansas St. are the only other two in BCS conferences).  This includes the dubious case of Seton Hall, who was the only BCS conference school of the 73 to not score a single point in the Sears Cup competition for 2006-07.  How is that possible?? 
Seton Hall

Days Long Since Gone at The Hall

Haves and Have-Nots.  The Pac-10 is the greatest example of bifurcation within a conference.  It has five of the top twenty athlademic programs in America (Stanford, UCLA, USC, Cal, Washington), but it also only has five of the top fifty programs – its next highest ranked school is Arizona at #51.  Compare this with the Big 10, who has nine of its eleven members ranked in the top forty, with only Indiana (#53) and Iowa (#58) weighing it down.  Conversely, the Big 12 only has two of its twelve schools ranked in the top forty – Texas (#11) and Texas A&M (#23). 

Non-BCS Stars.  We already mentioned the Ivies, whose eight schools average a 29.9 rating on our list.  But who else steps up to challenge the BCS big boys as an athlademic school?  The Naval Academy (#28) and a couple of the smaller UCs (Irvine (#35) & Santa Barbara (#39)) lead the way.  One surprise inclusion is our Mormon friends at BYU, who used a strong athletic showing to come in at 39th on our list. 

You can do Better.  Not to harp on anyone in particular, but it makes no sense to us that football (read: revenue) schools like Cincinnati (#196 in the Sears Cup), South Florida (#133), Mississippi St. (#120), Kansas St. (#111) and Syracuse (#110) can’t do any better with their overall athletic programs.  Let’s throw in Villanova (#132) and Marquette (#127) for good measure – both schools are wealthy private Catholic institutions, which means they have the resources to spread around the non-revenue sports.  So what’s their excuse? 

Share this story

NCAA D1 Athlademic Ratings

Posted by rtmsf on August 30th, 2007

We came across this table last week, but haven’t had time to properly analyze it until today.  An organization called the National Collegiate Scouting Assn. (NCSA) evaluated how schools are doing in their totality by ranking them in the classroom and on the fields of play, using the US News academic and Sears Cup athletic rankings as their evaluative criteria. 

If they’d just stopped there, we’d have no problem with their rankings.  However, they also felt a need to add a third criterion – the NCAA’s school graduation rates for student-athletes, which have been long derided as archaic, inconsistent and generally not useful as a tool for determining how well a school is serving and educating its student-athletes.  Use of these graduation rates as a performance measure ultimately results in a reductio ad absurdum situation where an elite academic and athletic instutition like Stanford is penalized because an obviously articulate and well-rounded athlete such as Tiger Woods did not formally graduate before turning pro.  

Graduation

A Relevant Indicator?  Not Here

And not only that, the NCSA decided to weight graduation rates equally (each counting one-third) with the academic and athletic ratings.  We could probably live with its inclusion if its weight was substantially minimized, but not as it currently exists.  Nevertheless, here is the NCSA list.  See Table A below.

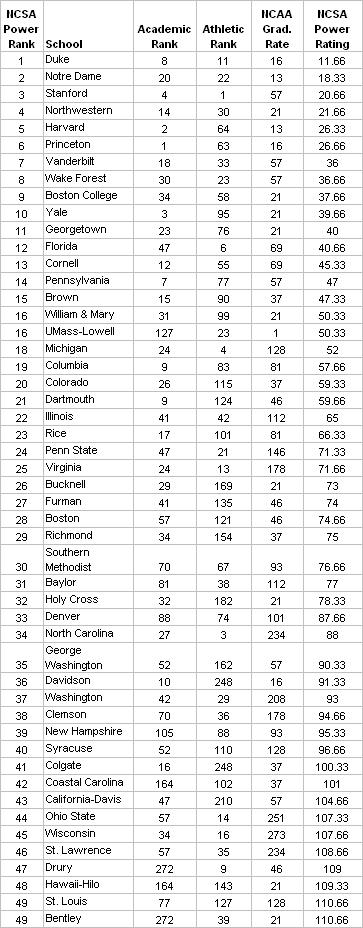
Table A.  NCSA Division I Power Ratings 

NCSA Ratings v.5

Ok, so we have no problem with many of the schools at the top – HYP, Duke, Stanford, Rice, the other usual suspects…  But look at some of the more dubious schools that piggyback a high graduation rate (and not much else) into the top 50 – UMass-Lowell??  Bentley??  Coastal Carolina??  The NCSA cannot be serious.

Bentley

According to the NCSA, Bentley Does Better Than Cal & Texas as an Academic/Athletic School

Additionally, consider the schools who do not have athletes who would normally be inclined to leave school early for the pros, train for the Olympics or seek more playing time elsewhere (not even benchwarmers leave Harvard).  The NCAA penalizes schools with transfers under its current metric for determining graduation rates.  Therefore, the Ivies, W&M, Furman, Drury, etc., all fare well in Table A because of the disproportionate weight given by the NCSA to graduation rates.  The bigger state schools that have excellent academics and athletics, yet are more vulnerable to market forces and playing time considerations – Michigan, UNC, Virginia, UCLACal – are all penalized using the NCSA method. 

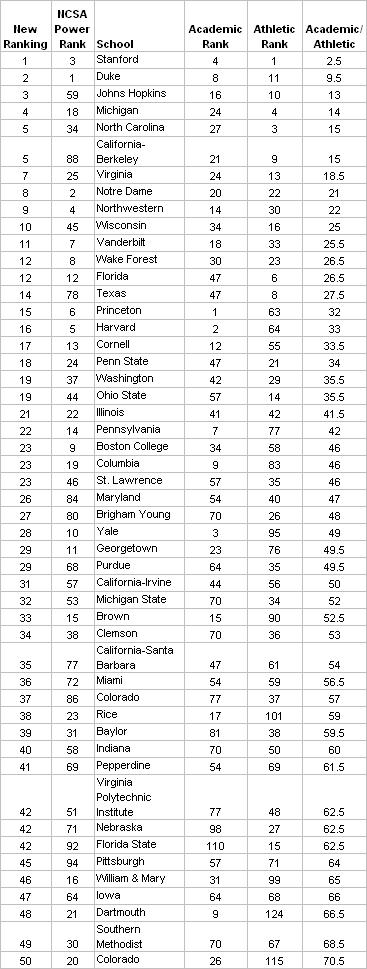
So let’s take a look at what the NCSA should look like, by eliminating the graduation rates and simply comparing academic success and athletic success.  See Table B below.

Table B.  Division I Ratings (US News + Sears Cup)

NCSA New Rankings

That’s more like it.  Stanford is in its rightful place at #1 (how could the #4 national university and 13-time defending Sears Cup winner not be?), and all the schools we’d expect to be near the top of such a list are there.  Look at some of the highest risers – Johns Hopkins went from 59th to 3d; Cal from 88th to 5th; Texas from 78th to 14th; Wisconsin from 45th to 10th. 

This list is instructive in the sense that it shows which schools are getting the most out of its academic and athletic programs, but the NCSA flubs it my weighing graduation rates on par with the other two much more informative criteria.  Maybe they’ll do better next year.     

Update:  a UCLA fan rightfully questioned us as to why the Bruins and crosstown rival USC were not originally included on our list.  After a few moments of thought, we realized that the NCSA list didn’t have either school in its top 100!!!  This can only mean that the LA schools’ respective graduation rates were so low that its weight carried both schools outside the NCSA top 100 D1 schools, essentially proving our point about the ridiculousness of its weighting system.  UCLA (#25 US News and #2 Sears Cup) would earn a rating of 13.5 in our system, which would place the Bruins #4 on our overall list.  USC (#27 US News and #5 Sears Cup) would earn a rating of 16.0, placing the Trojans #7 overall. 

Update #2:  After reviewing NCSA’s data, we decided a whole new post was warranted.  We revamp the entire list and also take a look at how the BCS conferences stack up in our Athlademic Ratings – Revised

Share this story

NCAA Tourney Conference Overachievers and Underachievers (1985-2007)

Posted by rtmsf on July 11th, 2007

Today we’re ready to unleash the last installment of our analysis of NCAA Tournament stats of the 65 (64) team era… that is, unless we decide to analyze the coaches too… well, it is over three months until Midnight Madness, so ok, hold that thought.  Anyway, as you hopefully recall, during the weekend we took a look at the raw numbers of the era by conference, and essentially concluded that the ACC has been the most successful conference of the last 23 years, the Pac-10 SWAC/NEC the worst, and that the mid-major conferences may not have been as consistently good as we had hoped over the years.

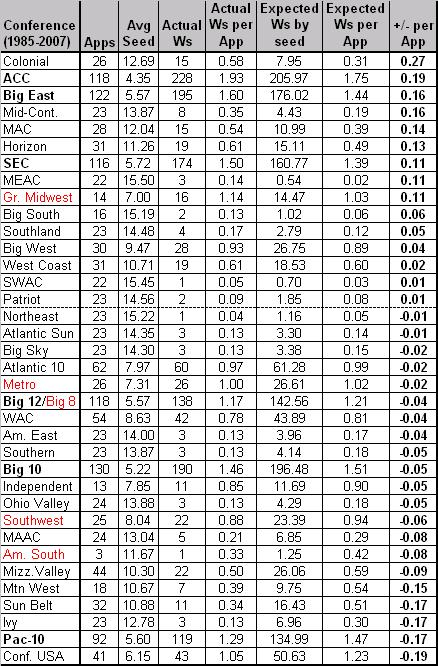
Now let’s take a look at the conferences who have overachieved and underachieved over the 65 (64) team era. In our analysis of this measure by school, you may remember that we looked at two different models – a Standard Model of expected wins by seed (e.g., a #1 seed should win 4 games per appearance), and a Historical Model of expected wins by seed (e.g., a #1 seed has actually won 3.36 games per appearance from 1985-2007). We concluded then that the true value lies in considering the Historical Model foremost because the Standard Model places too unrealistic of an expectation on high seeds and not high enough of one on low seeds, which ultimately skews its results in favor of lower-seeded schools and conferences. Given that condition, we now show the Overachiever and Underachiever conferences of the 65 (64) Team Era using the Historical Model. See Table A below.

Table A. Historical Model applied to 65 (64) Team Era

Notes: the table is sorted by “+/- per App,” which represents the number of games won above or below the expected number of wins for that seed per NCAA appearance (1985-2007). The conferences whose names are in bold are BCS conferences. The conferences whose names are in red are conferences that no longer exist.

NCAA Tourney by Conf v.3

Not Just George Mason. The first thought everyone will have (because we had it too) is that George Mason‘s miraculous run in 2006 accounts for the Colonial Conference’s rather aristocratic pedigree at the top of our list. But looking a little further inside the numbers somewhat mitigates this idea. Sure, the Masonites (as a #12 seed) won 3.52 games beyond its expected value of 0.48 wins per appearance in 2006, but that only accounts for half of the Colonial’s wins beyond expectation during this era. So where are the rest of the wins coming from? Thank David Robinson’s Navy squads of the mid-80s and Dick Tarrant’s Richmond Spiders in the immediate aftermath for the CAA’s perch as the biggest overachiever on our lofty list.

David Robinson

George Mason isn’t the only CAA School to Overachieve

BCStriation. Unlike our previous posting that used standard objective measures (wins, F4s, titles, etc.) to show that the six BCS conferences were without question the top six leagues of the era, today’s posting paints a substantially different picture. A league can be very successful objectively and still considerably underachieve, as in the strange case of the Pac-10 (and to a much lesser extent, the Big 10). Although the Pac-10 was clearly the weakest of the BCS conferences by the raw numbers, we certainly didn’t expect that it would be the second-worst underachiever of the 65 (64) team era – but it unquestionably is. The Pac-10 has won sixteen fewer games than it should have during this period, which dwarfs the negative output of any other conference – next in line for public shaming are Conference USA (7.6 wins fewer) and the Big 10 (6.5). Looking back at our list of chronic underachieving schools, we note that Stanford, Arizona and Cal all fall into the frequent NCAA underachievers list, which should have tipped us off that this was coming.

High Achievers. On the other side of things, the ACC and the Big East fall in line behind the CAA as the biggest overachievers of the era, which proves that you can get great seeds, have tremendous objective success in terms of wins and titles, and still overachieve as a conference. The ACC has won a whopping 22 games and the Big East 18 games beyond expectation; and the SEC isn’t far behind with 13. We also want to nod a tip of the hat to the Mid-Continent (+4.5 wins), MAC (+4 wins) and Horizon (+4 wins) conferences, each of which shows that leagues with consistently low seeds can do some damage on a regular basis in the NCAA Tournament.

Bradley

Missouri Valley Teams Need to Do More of This

What About…? If anything, these last two posts have opened our eyes to just how traditionally overrated the Missouri Valley Conference has been. For a so-called mid-major who gets multiple teams invited every year, its performance leaves a lot to be desired (4 wins below expectations). We realize that things change – conferences get better and worse over the years – but the MVC is going to have to really start producing in the next 5-10 years to lose our proffered overrated tag. As a comparison, the Horizon and West Coast conferences have performed nearly as well (19 wins each) as the MVC (22 wins) despite earning far fewer NCAA bids and having a slightly worse average seed.

Ivy League Paradox. We suppose that if you asked a hundred college basketball fans whether they believed the Ivy League traditionally overachieves in the NCAA Tournament, 99 of them would likely agree. This is probably due to a memorable upset or two over the years in addition to a common perception that the Ivies are a “tough out” every year. But looking above, we see quite starkly that the Ivy League has been one of the biggest underachievers of this era, earning only three wins versus an expected total of seven. This is largely because the Ivy champs (usually Penn or Princeton) have consistently earned seeds ranging from #11-#13 over the last decade, but haven’t been able to earn a single win during that period. The lesson here, we suppose, is to never take an Ivy team in your brackets (we’ve heard that taking an Ivy team against the spread in the first round is a good bet, however).

Share this story