Behind the Numbers: VCU & Butler Prove the Limits of Analytics

Posted by KCarpenter on April 7th, 2011

Kellen Carpenter is an RTC contributor. 
 
I should make my stipulations clear from the start: We should be talking Connecticut, but instead we will be talking about Butler. Before we talk about Butler, we will talk about Virginia Commonwealth University. The University of Kentucky, outside of this sentence, will not be discussed at all.

In a Shocker of Shakas, Smart Directed His Team to the F4

Continuing on: there is not a single analytic, logical or evidence-based approach that would have predicted VCU in the Final Four. Let’s be perfectly clear about this. In basketball analytics, most systems aim to predict likely future performance based on past performance and from that data calculate the most likely outcome. VCU in the Final Four was not a likely outcome by anyone’s reckoning. Sure, a few brackets had VCU in the Final Four, but that wasn’t because of rigorous analysis of match-ups or quantum wavelength formulas that are beyond us. Anyone who put VCU in the Final Four knew that it was an unlikely outcome. Maybe they put the Rams in because they were alums. Maybe their aunt lives in Richmond. Maybe they just think Shaka Smart is a handsome man (he is!). Maybe they picked the Rams because they knew few people would. All of these people who did actually pick VCU knew that it was a longshot as opposed to something that would probably happen.

This is smart. This is how you make brackets. Remember this. When there are thousands of different possible permutations, the most likely outcome is still pretty unlikely. An all-chalk bracket seems much more likely than any number of brackets in recent years, but it has still never happened. Hell, we’ve only had one year of all four number one seeds making the Final Four.  On a gut level do you feel that there is a significant difference between 1,000,000-to-1 odds and 1,500,000-1 odds? At the level of the infinitesimally unlikely, even big differences don’t seem to matter that much. I say this not as anti-mathematical nihilism, but to bring a sense of perspective to unlikely events. So here’s what I’m saying: when the most likely outcome is still incredibly unlikely to turn up, how surprising is it when something extremely unlikely happens? There is a real math answer if we gave these outcomes values, but the important answer, the one that we feel in our gut is that, no, it’s not really any more surprising than the other infinite variations of weirdness that the tournament spits at us every March.

Every bracket is a longshot prediction at a perfect bracket, which is such a rare and magnificent beast that not a single one was spotted this year (or any year, for that matter). In the ESPN bracket challenge, only two submissions out of 9.5 million even got the Final Four right. Long odds to get the bracket right, but of course, the odds that the teams themselves faced were not insignificant. Far smarter minds than mine have looked at the unlikeliness of the overall composition of this Final Four, the incredible journey of VCU to the Final Four, and the surprise of Butler in two back-to-back Championship Games; and while the supposed rarity and oddity of each of these accomplishments is interesting, it’s important not to lose sight of the big picture question: How did all these supposedly unlikely things happen and no one see any of them coming?

Read the rest of this entry »

Share this story

Behind the Numbers: Structures and Strategies

Posted by KCarpenter on March 23rd, 2011

 
Kellen Carpenter is an RTC contributor.
 
Nate Silver isn’t always right, but I’m beginning to wonder why I would ever bet against him. Last week, Silver published a consideration of seeding where he argued that because of the structure of the bracket, the eighth and ninth seeds are at a considerable disadvantage compared to much lower-seeded teams. This makes intuitive sense because the way the bracket is constructed the eight and nine have to play a top-seeded team before everyone but the sixteen seed. Still, it sounds funny and it is odd that a twelve seed has a better statistical chance of making the Sweet Sixteen than any other seed between seven and sixteen. I was intellectually able to read and understand this logic, yet I ignored the fact that because of this quirk in seeding, George Mason was worse off in terms of having a shot at making the Sweet Sixteen than Virginia Commonwealth or Richmond

The Spiders Perhaps Weren't As Much of a Surprise After All

One eight seed made the Sweet Sixteen. The rest of the Sweet Sixteen party crashers? Two eleven seeds, a ten, and a twelve, including Virginia Commonwealth and Richmond. If you tally up the rest of the seeds, this looks pretty much like Silver’s predicted distribution. The structural inequalities of the bracket should have told us to expect more second round (excuse me, “third round” upsets) from the seeds in the 10-12 range. Of course, are these even really upsets? The Pittsburgh loss to Butler was a genuine shock but the rest of the “upsets” really seem to fall upon the coin flip in the flat part of the s-curve.  Silver notes that the composite computer “power ratings” show essentially the same difference between first and second seeds as between the fifth and thirteenth seeds. What this means is what we knew all along: the best teams are in a whole separate class from the bulk of the teams in the tournament, while the majority of teams are at close to the same level. This is a long way to get to this essential point: We shouldn’t be surprised to see VCU, Richmond, Marquette or Florida State in the Sweet Sixteen.

We also shouldn’t act like the bracket design is done affecting who makes the Final Four and who wins the championship.  Ken Pomeroy was quick to run the log5 probabilities of the remaining sixteen and had some interesting findings. While you would think that winning two games would have increased every team’s chances of winning it all, you’d only be mostly right. San Diego State and Kentucky actually saw their chances at a championship drop as the biggest obstacles in their path to the championship refused to be upset. Conversely, Kansas’s location in the decimated Southwest Region has made them a near-prohibitive favorite to make the Final Four. Likewise, Pittsburgh’s ignoble fall in an already weak Southeast Region has given the Wisconsin Badgers a real shot at a championship. The Badgers’ calculated chances of winning it all went from a mere 2.5% to 9.5%. Of course, technically, that’s a tiny increase in proportion to the change in VCU’s chances. The Rams went from having a 0.0005% chance at a championship to a 0.2% chance at winning the big one. While those are still long odds, their chances of winning increased 400-fold. So that’s worth something.

Read the rest of this entry »

Share this story

Behind the Numbers: Against the Numbers

Posted by KCarpenter on March 15th, 2011

This is the one time of the year where people take an incredible interest in college basketball statistics. Folks who don’t know their Ken Pomeroy from their Jeff Sagarin rankings are suddenly asking how valuable a low turnover percentage is and if there is any evidence it correlates with tempo despite being allegedly tempo-free. Fortunately, there are lots of smart stat people who are willing to lend an analytic hand. If that’s what you are looking for, then let me point you in the right direction. 

Sullinger & His Buckeyes Perform Well in the Metrics

I obviously place a great deal of trust in respect in Ken Pomeroy’s statistical rankings that use Pythagorean expectation-based offensive and defensive efficiencies. Well, Ken has upped the ante by running a log5 analysis of the tournament field which breaks down the expectation of a given team to reach each round. Even more fun, Neil Paine at Basketball Reference ran Monte Carlo Simulation of the tournament 10,000 times using Pomeroy’s values and posted the very interesting results. Jeff Sagarin’s list uses scoring margin and a clever use of the Elo rating system (originally designed to rank chess players) to come up with his list of things to pick. Naturally, Nate Silver can’t resist weighing in with his method of making picks, which basically does for March Madness what Five Thirty Eight did for electoral math. His system, much like his polling methodology, is a weighted aggregation of different sources like Ken Pomeroy and Sagarin’s ranking plugged in with other factors that Silver thinks are important like geography, player ranking, and pre-season ranking. The sources he pulls from are exhaustive and smart while his methodology is well-reasoned. That said, it’s worth mentioning that a dumb “wisdom of the crowds” type list, such as ESPN’s national bracket (an average of all individual brackets) tends to outperform the majority of individual brackets.

Now, here’s the question: are you trying to predict the winner of games or are you trying to win a pool? These are not the same thing and it’s important to make the distinction. The national bracket, as I mentioned, usually gets a lot of the answers right. For the big questions, common sense is usually close enough. You want to know who has the best chance of winning the NCAA? Ohio State.  Pretty much every system, rankings, and analytics have Ohio State as the best team in the country. I happen to think this as well. I also think that the four number one seeds have the best chance of making it to the Final Four. Lots of folks agree with me and lots of analytics back it up.

Read the rest of this entry »

Share this story

Behind the Numbers: Focus and Balance

Posted by KCarpenter on March 9th, 2011

Kellen Carpenter is an RTC contributor.

What’s the ideal team look like? Is it five equally skilled players who share the ball and can all defend and score? A super deep team with ten guys who could all start? Does the ideal team have an alpha dog and a clear hierarchy? A dynamic duo? Maybe, a Big Three? If it’s one superstar and role-players, where does the superstar play? Is he a guard or a forward? One of the things that I enjoy most about basketball is that there is no clear consensus on any of these ideas. There is no ideal. Instead, we have a multitude of competing styles on offense and defense, each individual style perfectly capable of winning a championship.

How Important is the Bench to a Contender?

In 2010, the national championship went to a Duke team with a Big Three approach, focused on the perimeter. In 2009, North Carolina won by balancing a primary post option in Tyler Hansbrough with three skilled guards. The Kansas and Florida championship teams leaned heavily on their skilled big men. The point is that there are successful precedents for most styles, independent of focus and number of focal players. Now, despite these precedents, there is a common idea that a limited number of focal players makes a team more vulnerable. Intuitively, this makes sense: it’s easier to stop one player than many. Likewise, if a team has a single focus, like post scoring, it seems intuitively easier to stop that without having to worry about other threats, like perimeter shooting.

These ideas make sense, but I’m not sure they hold up. Teams with a single focal point, a single powerful talent, have been successful. Notably, in 2003, the indisputably Carmelo Anthony-led Syracuse team won it all. In a similar vein, the 2010 Blue Devils’ lack of reliable post scoring didn’t seem to impede their success. So, at least anecdotally, a lack of balance doesn’t seem to be terribly lethal to a team’s hopes for a championship. But, what about the question of depth? Doesn’t having a deeper team help a team win?

Not necessarily. If we look at bench minutes percentage, a measure of how many total minutes were played by non-starters, we can get at least some measure of a team’s depth. Generally speaking, a deep team will have more minutes played by guys on the bench. Last year, the two teams that played in the final, Duke and Butler, finished 1st and 12th in Ken Pomeroy’s Pythagorean rankings. Looking at these contenders and the ten teams that finished ranked between them, there was only a single team that was above the median in bench minutes percentage. Every other team was in the bottom half of bench usage, while many, notably Duke and Butler, were in the bottom fifth. Somewhat surprisingly, the one top team that used the bench at an above average rate was Brigham Young, a team that was primarily known for the singular talents of Jimmer Freddette.

Read the rest of this entry »

Share this story

Behind the Numbers: Defense and the Individual

Posted by KCarpenter on March 2nd, 2011

Kellen Carpenter is an RTC contributor.

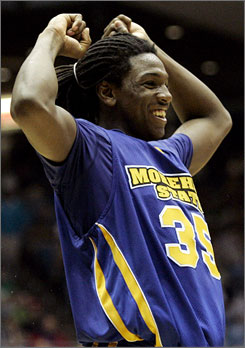
This is a story about Kenneth Faried and Morehead State. I know that it’s March now, and that Morehead State, who went 13-5 in the Ohio Valley Conference, has only the slightest chances of making a tournament splash. We have all March to talk about the contenders and the Big Dance. For now, let’s talk about Kenneth Faried and Morehead State. Actually, first let’s set the stage.

Faried is BTN's National Defensive POY

We are very good at measuring offense in basketball. We have a good sense of what is valuable and how much impact a player can make on the offensive end. The box score stats provide enough of a jumping-off point that a few bits of mathematical transformation can paint a pretty clear picture of a team or player’s impact on the offensive end. We’re talking about offensive efficiency, as good a tool as we have in college basketball. It’s so good, in fact, that we like to cheat and use opponent offensive efficiency to measure defensive efficiency, which is a pretty clever little trick. By measuring how opponents perform against a given team on average, we have some measure of that team’s defensive abilities.

The operative word here, however, is “team.” While we can tell how well a team performs by measuring their opponents foibles on offense, how do we assign individual credit? Not every player defends equally, and while I wouldn’t argue that defense isn’t a team effort, surely some players have a clear measurable defensive value over others. Defensive efficiency tells us very little about this.

Of course, maybe I was getting ahead of myself by plunging into advanced stats before just checking out the box score. Steals, blocks and defensive rebounds are all individually counted categories that suggest defensive aptitude, and indeed, after converting these categories into their tempo-free counterparts, we have a pretty good suggestion of players with specific defensive abilities. There are, however, problems with these categories. A block where an opponent retains possession really doesn’t do much good, yet those blocks are counted just the same as those that trigger fast-break opportunities. Steals generate extra possessions, but failed gambles for steals can lead to high-percentage shots. The example with steals highlights the bigger problem of what isn’t captured by the box score, namely, how good a player is at making the man he is guarding miss shots. Now, manual defensive charting and a thorough parsing of play-by-play data might be able to produce a pretty good individual opponent field goal percentage ranking, but so far, accurate and comprehensive data of this sort is just not available to us.

Read the rest of this entry »

Share this story

Behind the Numbers: Cliches and Champions

Posted by KCarpenter on February 25th, 2011

I like cliches, because they give me something to do. The proverbs of the sporting world and the received aphoristic wisdom of our hallowed forefathers are well-known and often taken for granted. They are also, fortunately, not too hard to test or analyze. I’m a fairly agreeable guy, but I must say, few things give me as much joy as being contrary in the face of stupid cliches. It’s an easy thing to do in the blogosphere, equivalent to shooting fish in a barrel, and there are many out there who are better gunslingers than I. But, for now, let’s joyously take aim at the hoariest one of all: “Defense wins championships.”

Great Sign, But Does It Win Championships?

Obviously, playing some defense is necessary to win anything. No one is arguing with that. But what the phrase really seems to mean is that teams with excellent defenses are the ones that win the big one. More than that, the phrase implies that defense, above offense, is the thing that separates the great teams from the good ones. Like so many things, it seems like our little proverb has things half right. In college basketball, the national champions have all been excellent defensive teams. The worst defenses to have won the title since 2003 are Syracuse (in 2003), or arguably, North Carolina in 2009 and even then, both of these teams had defenses that ranked in the top twenty in terms of defensive efficiency. Teams with bad defenses don’t win championships. If we want to take our proverb only this far, we can be happy.

The suggestion that quality defense is more important than quality offense is where the trouble starts. While every title-winning team since 2003 has had a quality defense, they have also all had quality offenses. The worst offense of any of these teams also belonged to that 2003 Syracuse team and it was, by Ken Pomeroy’s reckoning, the eleventh best in the country. So, it seems that we could, if we wanted, reasonably compromise and say, “Offense and defense win championships,” but that is ridiculously banal, and reasonable compromise is kind of boring. If you want to pick only one, offense is what wins championships.

Read the rest of this entry »

Share this story

Behind the Numbers: The Other Guys of the Year

Posted by KCarpenter on February 16th, 2011

Kellen Carpenter is an RTC contributor.

The Player of the Year race in college basketball is an interesting and bizarre thing. The most talented player is rarely selected, and the winner is seldom a National Champion. I don’t want to go so far as to say the race is a popularity contest, but it’s something akin to one. Instead of picking the best player, the voters like to pick the most emblematic player, or failing that, the most interesting. Oh, and that player has to almost inevitably be a bit of a ball hog. Evan Turner was not the best basketball player in the country last year, as fans of the Philadelphia 76ers know all too well, but he was a skilled-enough, multi-talented player on a pedigreed team that won a lot of games. With that logic in mind, it’s pretty safe to pencil in Jimmer Freddete, Jared Sullinger, Derrick Williams, Kemba Walker or Nolan Smith as the front-runners of that race. This was true in December, as well. I don’t want to say that the national Player of the Year race is dead, just that it’s perpetually unsurprising, even if the final result does have that extra spice of arbitrariness thrown in for good measure.

Walker Headlines a Strong NPOY Group of Candidates

So instead of breaking down the Player of the Year race and debating just how good, on the scale of really good to incredibly good all those familiar faces are, I thought we could take some time to show some love to some mostly unfamiliar faces who are having extraordinary and superlative seasons of their own. Maybe they don’t play a great all-around game, maybe their teams don’t win, and maybe some of them aren’t good so much as weird, but let’s celebrate them all anyway. We need a name for this party, though, so let’s call it the Other Guys of the Year Awards, dig into the depths of Ken Pomeroy’s stats tables, and hand out some imaginary statuettes.

The first awards go to a pair of players who play for the same team in the Big South. The Iron Man Award goes to Khalid Mutakabbir of Presbyterian who has played 96.1% of all available minutes, a greater percentage than any other player in Division I. Mutakabbir has used those minutes well, shooting a high percentage from the field, and a very impressive 51.7% from beyond the three-point line. The Ultimate Ball-Hog Award goes to Mutakabbir’s teammate, Al’Lonzo Coleman, who somehow comes off the bench, yet uses 36.3% of all possessions, more than The Jimmer himself. While Coleman is undoubtedly president of the Ball-Hog Club, let’s give some special recognition to the other players who, despite living outside the national limelight, have managed to dominate the ball more than Mr. Fredette: Special thanks to Keion Bell of Pepperdine, Anatoly Bose of Nicholls State, Brandon Bowdry of Eastern Michigan, Adrian Oliver of San Jose State, and Will Pratt from Northwestern State. You have all out-Jimmered the Jimmer, except for, you know, the winning games thing.

Read the rest of this entry »

Share this story

Alpha Dogs, Traffic Jams, and Derrick Williams

Posted by KCarpenter on February 10th, 2011

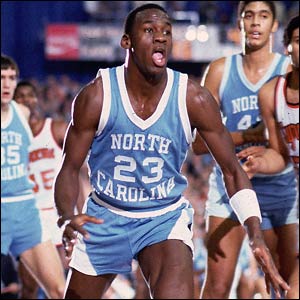
While we love to celebrate teamwork in college basketball, the truth is that the individual is much more fun. Balanced scoring is fine and tactically sound, but what we really love in college basketball is the virtuoso offensive performance, or as it is called in 2011, the Jimmer. And while the three-headed Devil from Durham may have won last season, perhaps this season, the one man show is back in style.  It’s Michael Jordan’s fault, really. His competitive nature and unbelievable personal narcissism motivated him to incredible heights and made him largely unbearable to most of his contemporaries. His success provided a model for greatness that was easy to recognize and hard to argue with. There are lots of different names for the Jordan model, but Bill Simmons’ version is probably the best known: The Alpha Dog.

Yeah, It's Safe to Call MJ an Alpha Dog

Simmons didn’t invent the concept or the term: lots of analysts, sportswriters, announcers and coaches have described the alpha dog model in one way or another over the years. The gist of it is this: A team needs an undisputed leader. The alpha dog is the go-to-guy on offense and is the guy who takes the game-winning shots. To win championships, you need an alpha dog. Jordan was an alpha dog (at least for the Bulls if not for North Carolina), and he is the primary reason his team won championships. Despite being a team game, you need an alpha dog to win, to demand the right to take the last shot. Guys who pass up the last shot aren’t alpha dogs: they are losers. At least, that’s the catechism. However, in the grand world of Simmon-isms, there may be another theory at play.

Specifically, I’m talking about the Ewing Theory, which in short, postulates that sometimes a team will play better without its star player, that the team will transcend the individual. Does this contradict the Alpha Dog theory? Well then it contradicts the Alpha Dog theory. Simmons, like Walt Whitman, contains multitudes. In any case, the Sports Guy has lots of examples, and anecdotally, lots of folks have seen this with their own eyes and believe it. It’s not too hard to imagine a scenario where this makes sense. The star is a volume scorer and fairly inefficient, and when the star is out of the game, the other players get more shots and more efficient shots. This is fairly intuitive and you can see the principle in action every Kentucky game. Terrence Jones is a sensational basketball player and undoubtedly incredibly skilled. That said, he is the fifth most efficient scorer on the team, but takes 30.5% of the shots. If he took fewer shots and his teammates took more, the team’s offensive efficiency would go up.

At Ohio State, Jared Sullinger uses, by far, the most possessions in each game, and for the most part, that’s fine. Sullinger is an incredibly efficient scorer with an offensive rating of 123.6 (points per hundred possessions). That said, Sullinger’s teammate Jon Diebler has an insane offensive rating of 139.1 and yet uses only 12.5% of Ohio State’s possessions. If I were to pretend you were naive here, you would then ask why Ohio State isn’t constantly feeding Jon Diebler. Fortunately, you aren’t naive and you understand that efficency is fleeting. Or if not exactly fleeting, curved.

Read the rest of this entry »

Share this story

Behind the Numbers: Slow and Steady and Sometimes Weird

Posted by KCarpenter on January 26th, 2011

Kellen Carpenter is an RTC contributor.

This is my favorite part of the college basketball season. Everything is more certain, yet still mutable: we know where things stand, but for most, it’s not too late for a strong push to finish the season. We don’t have to rely on pre-season guesswork or early returns: we have an idea of the mettle of most teams. The hype around fall flavors like Kansas State has been forgotten, and instead, we now read up on San Diego State. Here is the part of the season where we have taken stock of the landscape, the prologue is over, and now, we get to the good stuff: the build-up to conference championships and March confrontations.  That said, the landscape of college basketball is as interesting as it’s ever been. It would be wrong of us to move along too quickly without stopping to admire some of the interesting and stylistically odd teams that this season has given us. And speaking of moving too quickly, let’s take some time to look at some of the more interesting slow-as-Christmas teams in the country.

Ryan's System Works For Him

In Madison, they are, as always, playing Bo Ryan’s brand of basketball, but this year the team has achieved a special level of Ryan-ness. With an emphasis on fundamentals, this Wisconsin team is the pride of sanctimonious gym teachers across this fair land. The team rarely ever turns the ball over, easily leading the nation by surrendering the ball only 13.5% of the time. As a team, the Badgers are the best free throw shooting team in the nation, making 81.9% of their free throws. With those two distinctions, Wisconsin is now, if it wasn’t already, officially, the epitome of dad-basketball across the nation. Unfortunately, the meticulous style of play also means that Wisconsin leads the nation in one more category: slowest pace. The Badgers average 58 father-pleasing possessions a game.

At Samford, they are playing slowly as well, and while the style of play isn’t exactly dad-pleasing, it’s certainly interesting. It’s mostly confusing, but technically superlative in quite a few ways. Samford leads the nation in assist-to-field-goal ratio, which may or may not mean anything. They also easily lead the nation in proportion of three point shots taken, shooting 56.1% of their shots from beyond the arc. They are also the worst team in the nation at offensive rebounding, grabbing only 19.1% of available boards. I have not seen Samford play, but from the numbers I’m picking up on the kind of mad-genius idea that few coaches and teams have the stomach to implement.

Read the rest of this entry »

Share this story

Behind the Numbers: The Unimportance of Assists?

Posted by KCarpenter on January 19th, 2011

Pittsburgh, as Syracuse most recently learned, is a contender to win the national championship because they do one thing incredibly well and a lot of other things at a pretty high level. The one excellent thing they do is crash the offensive boards. They lead the nation in offensive rebounding rate, which is the driving force behind their current position as the most efficient offense in the country.  The Panthers do a lot of other things well– shooting, defensive rebounding, controlling turnovers– but nothing they do, in terms of advanced stats, really jumped out at me until I noticed that they are second in the nation in assists to field goals made. 69.8% of Pittsburgh’s field goals are assisted. This is interesting and pretty cool, but I began to wonder if it even mattered.

Assists are really weird, because in a way that’s not true of any other individual stat, they don’t really measure individual performance at all. To get a credited assist, the passer’s teammate has to knock down shots. Surround a healthy Kyrie Irving with four clones of someone who shoots as well as I do, and as crisp, creative, and well-timed as his passes are, he is not going to get too many assists, solely because, well, I am a terrible shooter.The box score for this game will show he got no assists. Did Kyrie have a bad game? Were his passes worse than usual?

Jamie Dixon's Team Moves the Ball Well

No, probably not, and that’s a tricky question. From close to the beginning of basketball box scores, assists have been tracked. In fact, in the early days of individual statistics, assists were really about the only thing tracked besides points and rebounds. Why do we even track assists? Maybe just because we always have. On some level, it’s easy to see what assists are supposed to do: assists are supposed to be a measure of play-making through passing. But as I mentioned, assists really aren’t all that great at measuring true ball movement because the statistic is hopelessly tangled up with field goal percentage. A team that makes more shots should generally have more assists. We don’t keep track of who made a great pass that led to a missed shot, and that really throws off our view of skilled passing and playmaking, which, after all, assists are supposed to measure.

There are more problems than that. We largely assume that assists are almost always positive. Passing is good. The problem is that sometimes it isn’t. Let’s suppose that we are on the fast-break, and I have the ball and my man beat. It would be easy for me to hit an uncontested layup. Instead, I drop the ball back to you, and you hit a slightly more difficult uncontested mid-range shot. I decreased the chance of us scoring with that pass, but got credited with the assist. That was a bad assist and these happen all the time. If you don’t believe me, watch Rajon Rondo “gun” for assists the next time you watch the Boston Celtics play.

Read the rest of this entry »

Share this story