Since there’s absolutely nothing going on this week, this is a good a time as any to start rolling out some of the data that we’ve been hoarding. First, a respectful tip of the hat goes to Florida Gator fan Louis Frank, who allowed us unbridled access to the detailed work in his NCAA Tournament database. Over the next week or so, we’re going to be presenting some descriptive statistics on the 64/65 team era of the NCAA Tournament sliced and diced in various ways.
Our first focus will be on individual team performance, viewed through the raw numbers and then with some analytical twists; then we’ll turn our attention to conference performance using the same parameters. The basic question we seek to answer is which teams and conferences tend to over- and underachieve in the NCAA Tournament since it expanded to 64 teams in the 1985 season? The reason we start with that somewhat arbitrary season is because from that point until now every championship team has had to win six games against seeded teams, with no exceptions. It also provides a tidy way of reviewing the data with a substantial sample of seasons – twenty-three – which also happens to coincide perfectly with the rise in popularity of NCAA basketball and the ESPN era.
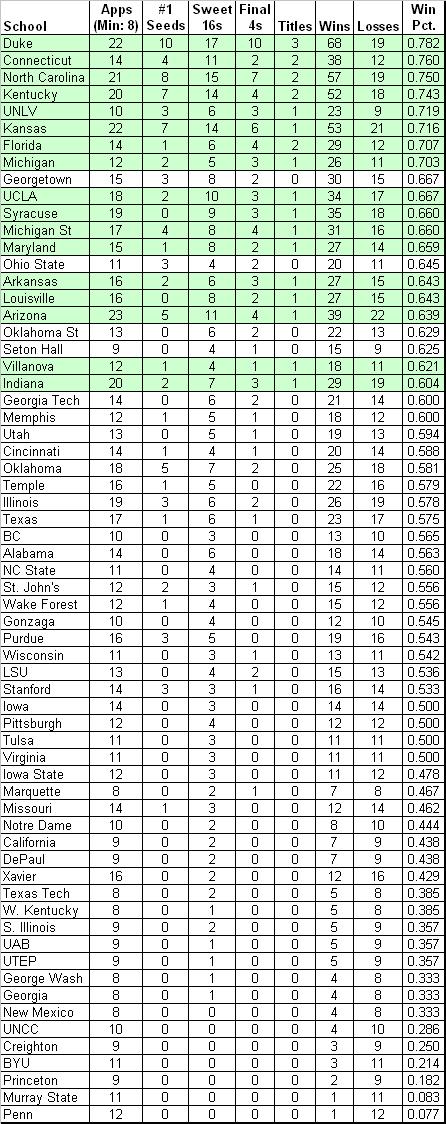
NCAA Tournament Success (1985-2007)
Notes: the chart is sorted by winning percentage (minimum: 8 appearances) from 1985-2007. The green shaded rows represent schools that have won a national title during this period.

Inside the Numbers:
Elite Eight. Of the 267 schools that have been invited to the NCAA Tournament during the last 23 years, the 64 listed above are the chronic repeat performers, each having made the Dance on at least eight occasions. Thirty-nine of those sixty-four have winning (> .500) records, but only a handful, eight, are elite (> .700 winning pct.). Suffice it to say that those eight elite programs account for 14 of the 23 (61%) national championships and 39 of the 92 (42%) Final Four teams during this era (programs with a national title are denoted above in green shading). These eight programs are: Duke, Connecticut, UNC, Kentucky, UNLV, Kansas, Florida and Michigan. Incidentally, Georgetown is the only school of the top 13 who did not have a title from 85-07, but dumb luck led to its 1984 title team being omitted from this list – apologies to the Hoyas.

You Have to Give the Devil His Due
The Krzyzewski Era. This era also neatly coincides with the rise of Duke as a basketball powerhouse – Coach K’s first Final Four was in 1986, and his string of success particularly from 1988-92 exceeds by itself almost every other school’s performance on this list. Duke has the most #1 seeds, the most Sweet 16 appearances, the most Final Four appearances, the most wins, the best winning percentage and the most national titles during this period. In several of those categories it leads by comfortable margins. We’ve made note that the current era of Duke basketball might be slipping a tad, but with numbers like the above to sustain, that may be an impossible task even for Krzyzewski. By these numbers, you’d have to go with North Carolina in second place and Kentucky a close third. Each has very similar statistics (appearances, #1 seeds, sweet 16s, titles, wins, winning pct.) in all but one category, Final Fours. Given the importance that the college basketball community places on reaching the final weekend, Carolina’s seven F4s to Kentucky’s four must trump, all else being relatively equal.
Traditional Powers. With Duke, UNC and Kentucky taking the top three spots by the raw numbers, how do the other three traditional powers of UCLA, Kansas and Indiana fare? Kansas is closest to the top group. The Jayhawks mirror UNC in many categories (including F4s), but its winning percentage is a little lower and it lacks that second national title that would vault it into the top three. UCLA experienced a couple of down periods during this era, but now appears to be on the rise again with two F4s in the past two seasons. Still, its top ten winning percentage (.667) and its national title in 1995 keep it in the second tier of performers over this era. Indiana has largely struggled since Bob Knight was forced out of Bloomington, but their consistency in making the tournament and winning a game or two (.604 winning pct.) – plus that national title in 1987 – probably keeps it in the second tier as well. There should be no question, though – if any of the traditional six powers were slipping in favor of one or more of the nouveaux riche, Indiana would be the choice here.

IU is Showing post-Knight Slippage
Nouveaux Riche. Of the elites, Connecticut and Florida are clearly the party-crashers. Prior to 1985, UConn had four wins and Florida zero wins in the NCAA Tournament. Each now has two national titles and a winning percentage of greater than .700. The question is whether these programs will be sustainable whenever Calhoun and Donovan decide to move on (Calhoun, to retirement; Donovan, as Christine’s full-time house-b*tch). The 64/65 team era is already littered with similar riches-to-rags stories such as UNLV, which fell hard when Tarkanian was indicted retired; and, Michigan, who also dropped out of the college basketball landscape once the gravy train of athlete peddler Ed Martin ended. Arkansas is yet another example – all three programs have a national title and multiple F4s to its credit, but long periods of poor teams and inconsistency places them in the second tier of the era.
Others in Second Tier. Several programs were consistenty excellent over this era, but their numbers weren’t as eye-popping as some of the above schools. Syracuse, Michigan State, Maryland and Louisville all claim a title to go with multiple F4s. Who knew other than Orange fans that Jim Boeheim’s squad never claimed a #1 seed during this era – that seems hard to believe. True, though – Syracuse’s best seeds were five #2s – during the glory days of Pearl Washington, DC, Billy Owens and company – 1986, 1987, 1989, 1990, and 1991. It looked like Michigan State was ready to become a top tier program 6-8 years ago, and they still are an excellent one, but its winning percentage needs to improve a little more to reach that level.

The Silver Fox has had his Ups and Downs
Whither Arizona? Arizona is the only school that was invited to the NCAA Tournament each year of this era. Yet Arizona’s success in the postseason leaves something to be desired for a program of its stature – multiple F4s and a title, but near the bottom of the championship-level schools in winning percentage. The Wildcats are a team to keep a watchful eye on when we present our over- and under-acheivers list later this week.
Rising Stars. Several programs to observe closely as we go deeper into this era are rising stars Georgetown, Ohio St., Memphis, Texas and Gonzaga. None yet has a title during this era, but each except Gonzaga has been to a F4, and all five are knocking on the door. These programs have the facilities and coaching in place to continue to rise up this list in the coming years.
Disappointments. Again, basing these observations on nothing more than raw numbers, you’d have to say that Oklahoma, Illinois, Purdue and Stanford have been the biggest disappointments. Collectively, these schools have had fourteen #1 seeds with only five F4s to show for it (obviously, zero titles as well). Although most of these programs have been consistently invited to the NCAA Tournament during this era, none has a winning percentage topping .600.
.JPG)

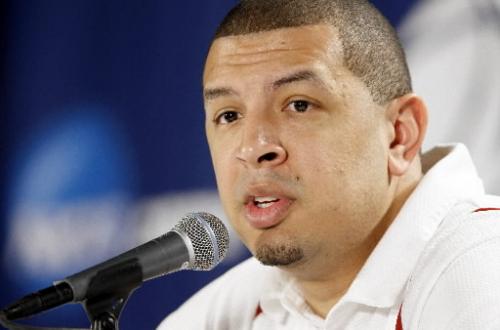
What did these two do to Missouri?
Embarrassments. We’ll leave the mid-majors like Xavier alone here, but we wanted to save special mention for some of the BCS schools who have managed to get invited multiple times, but really didn’t do much when they got there. Georgia‘s one sweet sixteen in eight appearances and its .333 winning percentage doesn’t say much for a program that always seems to be rebuilding; Bob Knight’s Texas Tech doesn’t fare much better (two sweet sixteens). But the real winner of the most pathetic NCAA-caliber program award, in our estimation, has to belong to Missouri. The Tigers have been to the tournament fourteen different times during this era, even once as a #1 seed, and have only managed three sweet sixteen appearances, two elite eights and an overall losing record (.462). Serious congrats are in order for Norm Stewart and Quin Snyder. Mike Anderson has his work cut out for him. The saddest part is that Mizzou traditionally likens itself as a basketball school!
Ivy Sadness. The last word goes to Ivy stalwarts Penn and Princeton, two schools who show up every year (21 of the last 23 NCAA Tournaments) at the right time and venue, battle hard for about thirty minutes against a superior athletic opponent, then go back home and lick their wounds for another year after inevitably wearing down to the size and strength of its opponent. They may be a collective 3-21 (.125) in the Dance, but who will forget when they pull the big upsets, like Princeton 43, UCLA 41 (1996), or Penn 90, Nebraska 80 (1994). Ok, maybe beating Nebraska isn’t a big upset after all, but we still love the UCLA upset.
Coming Next: now that we’ve analyzed the raw numbers of the 64/65 team era of the NCAA Tournament, we’ll next be taking a look at the over- and under-achievers during the same period. After seeing the above, can you project who the best and worst will be? You might be surprised at some of the results. View Overachievers and Underachievers here.


.JPG)


