We’ve received a resounding response on the post Tuesday evaluating school performance during the 65 (64) team era, so let’s waste no time in presenting Part II of our statistical profile of the NCAA Tournament during that period. As we alluded to in that post, looking at raw data in a vacuum has its limitations. From that data we got a reasonable sense of which programs have had the most success during the period, but it didn’t really give any insight as to which programs have overachieved, underachieved, or simply performed about as expected.

Which Schools Reach Their Potential?
Today’s post will address that issue. You might want to bookmark this page for next year’s bracket-filling, because we feel that what we’re showing today has significant value in determining those schools that tend to embrace expectations and those that tend to wither in the face of the red-hot lights of March. Stat geeks like ourselves should enjoy this post – hopefully it won’t bore the rest of you.
The first consideration in trying to determine which programs have overachieved and underachieved is how to answer that question. Traditionally, you often hear commentators and writers talk about “playing to your seed,” which essentially presumes that a #1 seed should make it to the Final Four, a #2 seed to the Elite Eight, and so on (see Table A below). Using this model, a team that wins any games beyond the expected wins of its seed would fairly be said to have overachieved as to the expectations of the seed (and vice versa).
Table A. Standard Model
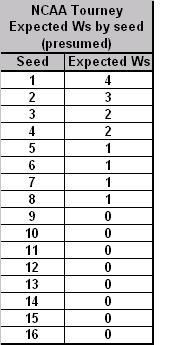
So let’s try to first answer that question using the Standard Model outlined in Table A. But don’t give up on the post after you review the Standard Model results, as we have another model below it that may bring up new and interesting considerations. The Standard Model as applied to the 65 (64) Team Era is Table B below.
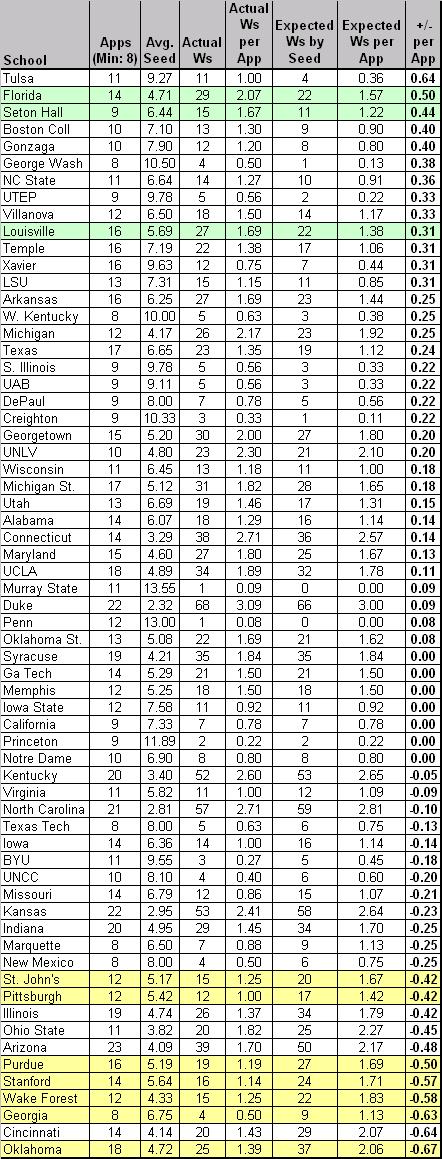
Table B. Standard Model Applied to 65 (64) Team Era
Notes: the table is sorted by “+/- per App,” which represents the number of games won above or below the expected number of wins for that seed per NCAA appearance (1985-2007). The rows colored in green highlight schools that are in the top twelve spots of both Tables B and D. The rows colored in yellow highlight schools that are in the bottom twelve spots of both Tables B and D.
Inside the Numbers (Table B):
Overachievers. What first jumps out at us using this method is just how (except Florida) there are no big names near the top of the list. Tulsa, Seton Hall, GW, UTEP, Temple? Without taking away from their performance – after all, every one of those teams should be commended for overperforming versus its seed – this immediately suggests to us that the Standard Model often used by the pundits actually favors lower-seeded teams who manage to win a game or two every couple of years in the NCAA Tournament. Using the schools above +0.30 as a natural break point, only Florida, Louisville and Temple have won more than twenty games in the NCAAs during this period, and the average seed of these thirteen schools was 7.0. Are these teams chronically underseeded or are they overachieving as a general rule? Whatever the case, we’re going to think a little harder about picking Tulsa the next time they make the bracket.

Are the Golden Hurricanes the Biggest NCAA Tourney Overachievers?
Underachievers. A brief look at the names at the bottom of the list – Oklahoma, Cincinnati, Wake Forest, Stanford, Purdue, etc. – tells us that we’re on to something here. As our good buddy MK says, “Wake and Purdue can effin’ bite me. They kill my bracket every year.” Or something like that. Using -0.42 as a natural break, the eleven teams at the bottom averaged a seed of 4.8 during this period, which is a marginally better seed than the overachievers on this list. Oklahoma, Arizona and Illinois – what do you have to say for yourselves? Each of you has had at least 18 appearances during this era, averaged a solid if not spectacular seed between #4 and #5, and consistently played below that seed to the tune of -0.42 wins per appearance or worse. This matches Tuesday’s analysis with Oklahoma as a disappointment; but under this model, Arizona and Illinois (second tier elite performers on Tuesday) have some explaining to do.

You May Want to Avoid These Guys in your Brackets
You’ll See Them Again on the Long Road Back to the Middle. The Big Four from Tuesday – Duke, UNC, Kentucky and Kansas – find themselves in the middle of the pack. It’s notable that Duke averaged a seed of 2.32 during this era and still overachieved by +0.09 wins per appearance relative to seed. UNC and Kentucky are verrrry slightly underachieving, whereas KU’s recent vintage teams (2005 & 2006) probably contribute to its slightly lesser position at -0.23 wins per appearance. UConn should be lauded for overachieving at a clip of +0.14 wins per appearance, which somewhat mitigates their overall lack of F4s – they do win a lot of NCAA Tournament games. Syracuse, Georgia Tech, Memphis, Iowa St., California, Princeton and Notre Dame – all of these programs have played exactly to seed in the last 23 years. Be sure to remember that fact next year when filling out your brackets.
Criticism of the Standard Model. The primary problem with evaluating NCAA Tournament success based on “playing to the seed” is that it puts an unrealistic burden on highly-seeded teams because over time they never play to their seed. In the knockout crucible that makes the NCAA Tournament so exciting, a corollary result of using this criteria is that higher seeds (#1-#4) are largely set up to fail, and lower seeds (#9-#16) are significantly overachieving simply by winning one game. Additionally, we feel that using the Standard Model assumes too much at the squishy margins – that a #4 seed should win two games, a #5 seed should win only one game, and that a #8 seed should always beat a #9 seed – when both teams are probably very similar in ability. For this reason, we now offer an alternative model, one that considers actual historical performance of the seeds.
To that end, see Table C below for a historical snapshot of how well each seed actually performed in the 65 (64) team era.
Table C. Historical Model
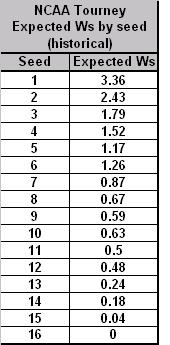
Considering Table C, we wanted to point out for a moment that we have a couple of thoughts. First, we found it interesting that #6 seeds have traditionally performed better than #5 seeds. This at first seems anathema to conventional wisdom, as a #6 likely has to get past a #3 in the second round, whereas a #5 must only defeat a #4. That is, until you remember that a #5 has the dreaded 5-12 match-up that knocks out so many higher-seeded teams (excepting 2007, of course). Also, it’s interesting that a #10 seed has a better historical expected number of wins than a #9 seed. This shows again that a better draw is to avoid the 8-9 match-up, even if you end up as a lower (but more likely to succeed) #10 seed.
Using the 1985-2007 Historical Model as a baseline expected value for each seed, our list of 64 schools is now featured in Table D below.
Table D. Historical Model Applied to 65 (64) Team Era
Notes: the table is sorted by “+/- per App,” which represents the number of games won above or below the expected number of wins for that seed per NCAA appearance (1985-2007). The rows colored in green highlight schools that are in the top twelve spots of both Tables B and D. The rows colored in yellow highlight schools that are in the bottom twelve spots of both Tables B and D.
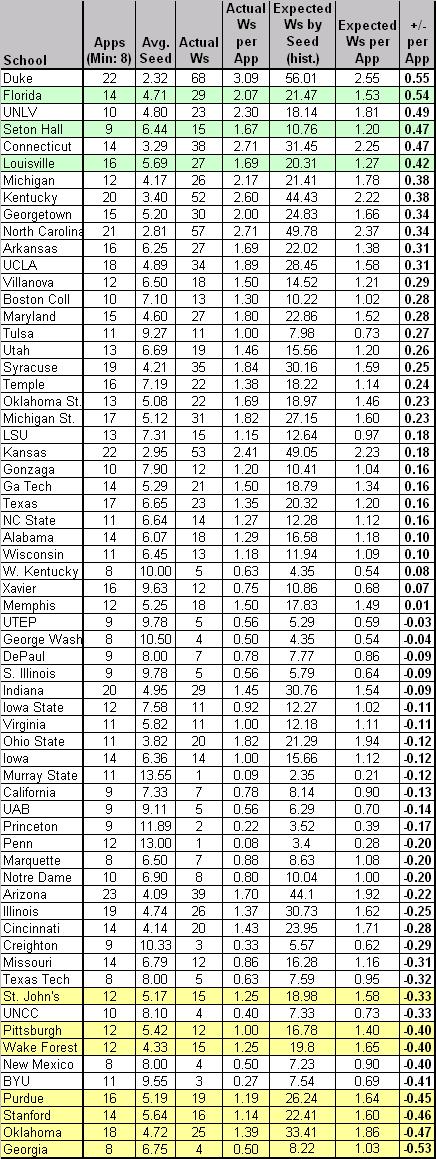
Notable Differences. Using the Historical Model, the first thing that strikes us as interesting is that many of the heavy hitters of the era have jumped considerably, including some all the way to the top of the list. In fact, the following schools – Kentucky, UNC, Duke, Kansas, UConn, UNLV, UCLA, Syracuse, Ohio St. – all rose at least fifteen places from where they were situated in Table B. Each of these schools (excluding Kansas and Ohio St.) have overachieved at least +0.25 wins per appearance above the historical performance of their seeds. Since these schools represent a total of thirteen championships and thirty-eight F4s during this era, the Historical Model viewpoint makes more sense than what the Standard Model shows.
Who Dropped? Creighton, George Washington, UAB and UTEP all went from nice-looking overachievers in Table B to slight underachievers using this model. NC State, Xavier and Gonzaga looked fantastic using the Standard Model, but look rather pedestrian using this one. The explanation for this is simple – these teams collectively averaged a #9 seed throughout this era – if we use the Basic Model, they should never win a game, so when they do, it looks as if they’re significantly overachieving. However, using the Historical Model, we see that they actually win NCAA Tournament games roughly commensurate with how a #9 seed typically performs. This again illustrates why we feel this model shows a truer snapshot of performance.
More Importantly, Who Stayed the Same? Now this is where it gets really interesting. The rows shaded in green in Tables B and D represent schools that were in the top twelve in playing beyond its seed using both models. You could accurately say that, no matter how you slice it, Florida, Seton Hall and Louisville are the truest overachievers of the 65 (64) team era. (Incidentally, Florida and Seton Hall are in the top four of both tables, with each school averaging an extra win beyond its seed for every two appearances in the NCAA Tournament.) These three schools consistently play beyond the actual and historical expected value of the seed that the NCAA Selection Committee gives them.
The rows shaded in yellow at the bottom of Tables B and D represent the true underachievers. These schools were in the bottom twelve in playing below its seed using both models. What’s peculiar about this statistic is that there appears to be a much greater correlation between the tables with respect to the underachievers than with the overachievers. Whereas the overachievers only had three common schools between the tables, regular NCAA disasters such as Georgia, Oklahoma, Stanford, Purdue, Wake Forest, Pittsburgh and St. John’s find themselves in both at the bottom looking up. If you are at all like us and believe that the weight of history contributes as a predictor of the future, then anyone reading this post should be extremely hesitant picking these schools to play beyond its seed to its seed in the Dance in the years going forward.
And Now, the Chicken/Egg Argument. Whether you buy into the Standard Model or the Historical Model or neither, we can say without a doubt that some schools appear to consistently overachieve relative to its seed, while others consistently underachieve relative to its seed. The question we want to posit to the readers is what causes this – is this simply a statistical anomaly? Are the overachievers regularly seeded too low by the NCAA committee; or, are the underachievers regularly seeded too high? Is there a self-fulfilling prophecy at work here, where schools that are known as chronic underachievers (ahem, Oklahoma) place so much pressure on themselves that they tighten up in the clutch? Conversely, do the overachievers find their wits amidst chaos to consistently come through under pressure because they are expected to do so? These are questions that we cannot answer, but we figure that there are elements of each at play here. We’d certainly like to hear your thoughts on this and any other topic. Oh, and apologies for the long post today.
Coming Next: We’ll take a look at the raw numbers again, but this time we’ll examine it by conference, which isn’t as easy as it sounds. Do you realize how many conference re-alignments and mergers and dissolutions there have been in the last 23 years of NCAA basketball?


