68 NCAA Tournament Facts Heading Into Madness…

Posted by William Ezekowitz on March 17th, 2016

Here’s a dirty little secret about March Madness. The difference between a bad bracket and a good bracket is skill, but the difference between a good bracket and a great bracket is luck. Anyone who has won their pool has gotten lucky. A lot of these games are basically coin flips or won by buzzer-beaters, and nobody can predict that kind of thing. You just have to hope enough of those breaks go in your favor. Where you can distance yourself from your competition, though, is in the 60-40 or 55-45 games. If you can figure out which team has a slight advantage and pick enough of those teams with those slight advantages, odds are something will break your way one of these years. That is the purpose of these 68 Facts, to help isolate some favorable and unfavorable matchups going into the NCAA Tournament. Hopefully they will help your bracket — or at least help you justify your bracket to yourself, which is debatably more important anyway. Let’s get to it.

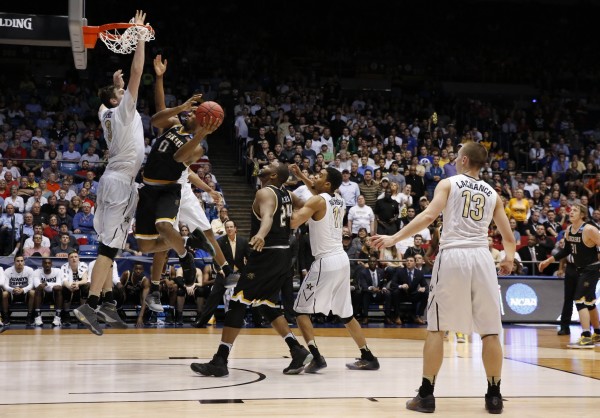
March is Here (USA Today Images)

March is Here (USA Today Images)

  1. California is 18-0 at home and 5-10 on the road or at neutral sites.
  1. Providence’s Kris Dunn hasn’t looked like himself lately, scoring single-figures in three of his last six games, after having just two such outputs in his first 25 games.
  1. Kentucky has the lowest defensive assist percentage in the country. Indiana gets assists on an above-average proportion of its field goals.
  1. Of Dayton’s seven losses, five have come when one of the Flyers’ three best players, Charles Cooke, Dyshawn Pierre and Kendall Pollard, was not playing. All three are healthy and eligible for the NCAA Tournament.
  1. Cal State Bakersfield’s 25th-most efficient defense is anchored by the 16th-best steal rate in the nation. Oklahoma surrenders steals at a rate that is 300th-best in the country.
  1. Iowa had the nation’s fifth-best offense through 22 games. In the last nine games, accompanied with a record of 3-6, the Hawkeyes were at the D-I average.

Read the rest of this entry »

Share this story

Tracking The Four: Scouting Reports

Posted by EJacoby on January 27th, 2012

Evan Jacoby is an RTC contributor & correspondent. You can find him @evanjacoby on Twitter. TT4 will cover four selected teams of interest – Syracuse, Indiana, Murray State, and UNLV – by tracking their ups, downs, and exciting developments throughout the course of the season.

You know each of our four team’s records, you can see where they’re ranked relative to other teams, and their advanced statistical breakdowns are easily accessible on sites like StatSheet and KenPom. But what about how they actually look in person? If you haven’t watched these teams play multiple times this season, we have the quick-hitting analysis of their strengths and weaknesses. This week’s TT4 Wildcard gives a scouting report for each team, which is a useful way to compare and contrast teams and also look at how they perform in future games relative to their expected tendencies. Feel free to chime in if you think we missed on something!

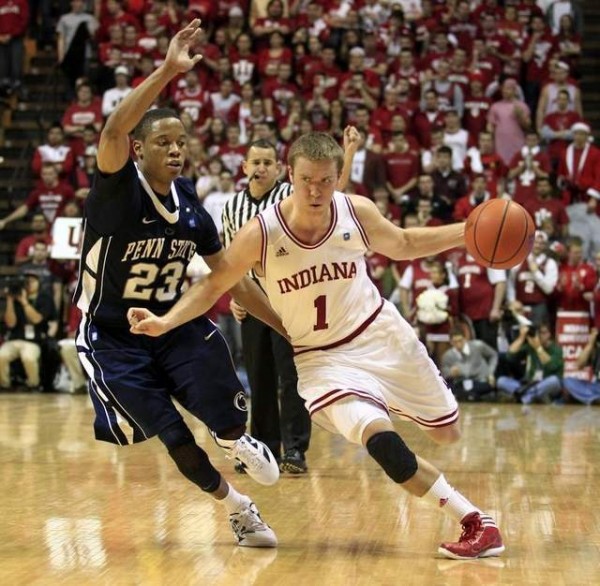
A Dynamic Offensive Attack has Led to Indiana's Success (AP Photo)

Indiana Hoosiers

Strengths:

  • They space the floor very well offensively, capable of attacking from a variety of angles… Capable of running offense inside-out through Cody Zeller, or outside-in by swinging the ball around the perimeter amongst a number of dangerous scorers.
  • Great perimeter shooting… They take good shots, which leads to a high three-point percentage… Jordan Hulls and Matt Roth have unlimited range on their shots… Christian Watford excels in the mid-range.
  • Cohesive unit that has started the same five players in every game… Starters and reserves both know their roles.

Weaknesses:

  • Poor perimeter defense, often leaving opposing guards without much ball pressure… Allow opponents to run offense comfortably.
  • Lack depth in the frontcourt, putting themselves in a bad position if Zeller is fatigued or in foul trouble.
  • No true point guard on the roster has led to struggles penetrating offensively… Poor assist percentage for such a high-scoring offense.

Overview: A dynamic offensive team that thrives during up-tempo games, enabling them to consistently space the floor and hit open shots… Struggle defensively in the half court with physical teams, and can get in trouble when Zeller or Watford get in foul trouble… Very streaky performance has led to extended runs and deficits during games… Improving defensive team but continue to have trouble getting stops in conference play.

Read the rest of this entry »

Share this story

Stat Nerds of the World, Unite.

Posted by rtmsf on December 29th, 2008

If you know anything about us here at RTC, you know that we love numbers.  We love breaking down game stats and looking for secrets in the offensive and defensive efficiency ratings that will help us better understand why Team X is playing so poorly or why Team Y is much better than their ranking.  We also love statistical oddities – little factoids of generally meaningless but still interesting data that we can bring up at RTC office parties and cocktail functions so that we’ll seem edumacated and wicked smart about the ins and outs of college basketball.  Or at least so that we can impress Dickie V when we next run into him at a spring training Rays game.  Yeah, that.

stat-nerds

So here are a few of the statistical items that we find interesting as we approach conference season – perhaps you will also.  (all stats furnished by basketballstate.com)

  • These guys had better avoid foul trouble. UAB’s Robert Vaden, Texas’ AJ Abrams and Virginia Tech’s AD Vassallo each average over 36 minutes per game for their teams.
  • Get these men the ball! Among players scoring 15+ ppg, St. Joseph’s Ahmad Nivins (74.2%), Kentucky’s Patrick Patterson (71.5%), Oklahoma’s Blake Griffin (67.9%) and Michigan St.’s Raymar Morgan (65.3%) are burning up the nets.
  • Double-Double Trouble. Of the 19 players averaging double-figure rebounds, all of them also average double-figure points.  But only two of them are 20/10 guys – Blake Griffin (23/14) and Notre Dame’s Luke Harongody (23/12).  Patrick Patterson is just a whisker shy of 20/10 (19.6/9.5).
  • Betcha Didn’t Know That…
    • Stephen Curry leads the nation in scoring (30.0), but Tyler Hansbrough puts up the most points per 40 minutes (34.4)
    • North Dakota State’s Ben Woodside, he of the 60-pt explosion two weeks ago, is #2 in the nation in assists (7.6 per game).  Or that Davidson’s Mr. Curry is 12th nationally in dime-dropping.
    • Kentucky guard Jodie Meeks is averaging 24.2 ppg so far this season.  The last Wildcat to average that many points per game was Dan Issel in 1969-70 (33.9).
    • VMI’s brother tandem Travis and Chavis Holmes are 1-2 nationally in pilfering the ball (4.0 and 3.7 spg).
  • Tempo Free Stats.
    • UNC is the most efficient offensive team in the nation (1.19 points per possession), but did you know that Purdue is the most efficient defensive team around (0.79 ppp)?
    • The tops of the ACC and Big East have extremely efficient teams on both ends of the court – UNC, Wake Forest, Duke, UConn, Pittsburgh and Georgetown all have large differentials (approaching or above 0.3 ppp) resulting in an extra point every three or four possessions down the court.
    • The slowest paced “good” team is Wisconsin, with 61.4 possessions per game.  UNC, unsurprisingly, is averaging 79.3 possessions per contest.
    • Pittsburgh, Cincinnati and West Virginia own the boards, each team getting at or nearly 60% of the available caroms.  It’s difficult to find a “good” team that can’t rebound the ball, but Creighton is the best candidate for this award, only getting its Blue Jay hands on 48.2% of rebounds.
    • Notre Dame only turns the ball over one of every eight possessions (13%), but Kentucky gives it away nearly a quarter of the time (24%) and has still managed to go 10-3 thus far.  Incidentally, the Irish also rarely foul opponents (#1 in the nation with only 11.8 per game).  Tennessee, with all of its reaching and grabbing pressure defense, garners 21.3 fouls per game.
    • Georgetown, Connecticut, Xavier and Oklahoma live at the foul line, each getting a quarter or more of its points from the charity stripe.  Illinois, on the other hand, only gets about 14% of its points from the line.
    • The best offensively efficient performance by one team in a legit game this season so far was UNC  vs. Notre Dame, where the Heels averaged an astonishing 1.53 ppp in that demolition.

Got any others?  Feel free to pass them along in the comments!

Share this story