Posted by Brad Jenkins (@bradjenk) on January 20th, 2017
With approximately one-third of conference play now in the books, it’s time to take a closer look inside the ACC numbers. This is the first edition of our weekly look at the current ACC standings with a focus on which teams are playing better or worse than their records may indicate. We will also delve into some advanced metrics to find a few interesting notes on teams, statistics and trends. Finally, we will forecast how the final ACC standings may look given current efficiency margins, and what that may mean for teams’ postseason aspirations.
Note: All numbers are current for games played through Wednesday, January 18.
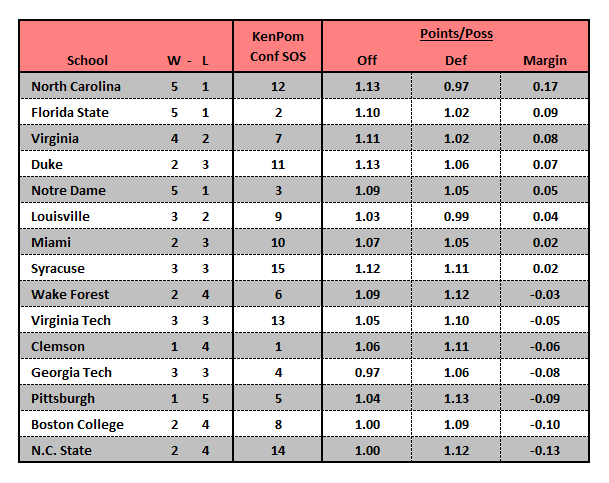
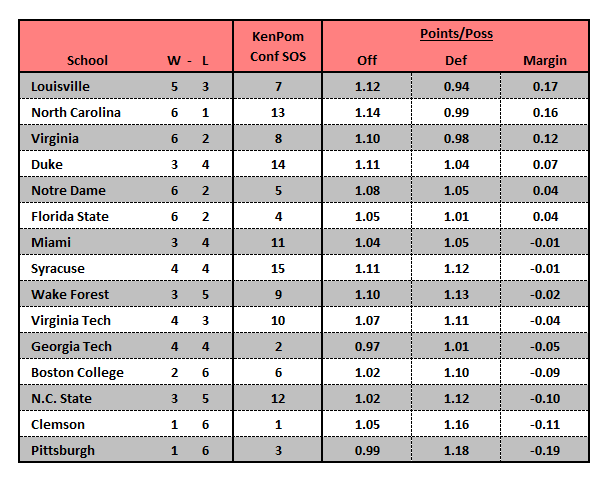
Current Standings With a sample size of games this small, any one-game extreme performance can really impact the season numbers. This means that some of what we see in the table above is the result of two ACC blowouts — North Carolina’s 51-point rout of N.C. State, and Duke‘s 53-point beating of Georgia Tech. The Tar Heels are currently leading the league in both offensive and defensive efficiency, mostly because of their incredible dominance on the boards. North Carolina’s 44.0 percent offensive rebounding rate in ACC play is even higher than its nation-leading mark for all games (42.7%). Florida State and Notre Dame have achieved great starts (both are 5-1) despite facing two of the three toughest league slates to this point. At the other end of the ledger is Clemson, which has only managed a single win over Wake Forest while playing the toughest conference schedule. The Tigers’ actual performance margin, however, is better than the three squads ahead of them in the standings, so maybe they are not struggling as much as it appears.
Read the rest of this entry »
| acc, feature, microsites
| Tagged: acc, boston college, clemson, duke, florida state, georgia tech, louisville, miami, n.c. state, ncaa bids, ncaa seed, north carolina, notre dame, pittsburgh, syracuse, virginia, virginia tech, wake forest
Share this story


 With a sample size of games this small, any one-game extreme performance can really impact the season numbers. This means that some of what we see in the table above is the result of two ACC blowouts — North Carolina’s 51-point rout of N.C. State, and Duke‘s 53-point beating of Georgia Tech. The Tar Heels are currently leading the league in both offensive and defensive efficiency, mostly because of their incredible dominance on the boards. North Carolina’s 44.0 percent offensive rebounding rate in ACC play is even higher than its nation-leading mark for all games (42.7%). Florida State and Notre Dame have achieved great starts (both are 5-1) despite facing two of the three toughest league slates to this point. At the other end of the ledger is Clemson, which has only managed a single win over Wake Forest while playing the toughest conference schedule. The Tigers’ actual performance margin, however, is better than the three squads ahead of them in the standings, so maybe they are not struggling as much as it appears.


