Posted by nvr1983 on January 10th, 2012
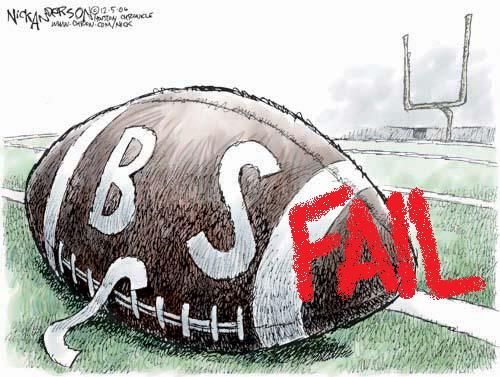
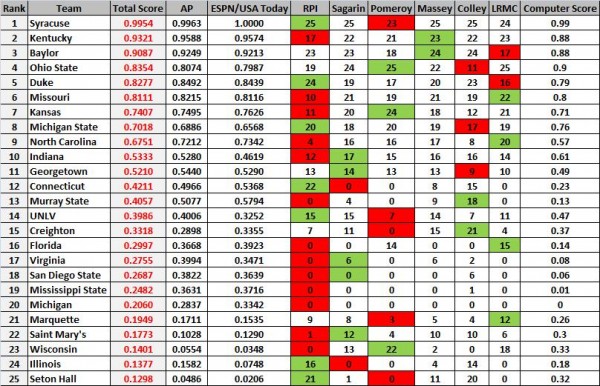
With last night’s unique, electric, and egalitarian college football championship game behind us we figured it was time to pull out our RTC BCS Poll. For those of you who are unfamiliar with the concept, we are applying the BCS formula to college basketball to see what the results would be if college basketball had a BCS system instead of actually deciding a champion on the court. We have done this each of the past three years. Here are the results from 2009, 2010, and 2011. The posts are from various points in the season (either midway through the year or potentially at the end of the regular season) This year we are going to try to expand it out a little further and track the changes essentially from the start of conference play.

The rules are essentially the same as the BCS and as in previous years (with a few upgrades):
- We are following the BCS Football guidelines as closely as possible, but we replaced the Notre Dame rule with the Duke rule since they both have sketchy TV contracts (Notre Dame with NBC and Duke with ESPN).
- The AP and ESPN/USA Today polls are used as the human polls and RPI, Sagarin, Pomeroy, Massey, Colley, and LRMC as the computer polls. The human poll scores are calculated as a fraction (in decimal form) of the percentage of possible votes (1625 in the AP and 775 in the ESPN/USA Today respectively). Like the BCS we remove the highest and lowest computer rankings from a team’s overall computer ranking. The highest and lowest rankings are noted with green and red boxes. In the even that there were multiple similar highest or lowest scores we picked the first one in chart.
- We used the traditional BCS calculations for determining each team’s score weighing the two human polls and the combined computer poll average as 1/3 of a team’s total score each.
Read the rest of this entry »
| bcs poll, Regular Features
| Tagged: alabama, baylor, california, connecticut, duke, feature, illinois, indiana, kansas, kentucky, michigan, missouri, murray state, north carolina, notre dame, ohio state, st louis, stanford, syracuse, uconn, unc, unlv, wisconsin
Share this story


