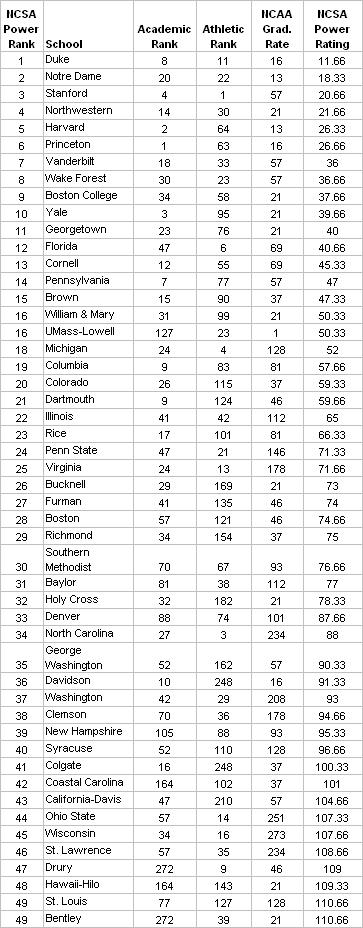
We came across this table last week, but haven’t had time to properly analyze it until today. An organization called the National Collegiate Scouting Assn. (NCSA) evaluated how schools are doing in their totality by ranking them in the classroom and on the fields of play, using the US News academic and Sears Cup athletic rankings as their evaluative criteria.
If they’d just stopped there, we’d have no problem with their rankings. However, they also felt a need to add a third criterion – the NCAA’s school graduation rates for student-athletes, which have been long derided as archaic, inconsistent and generally not useful as a tool for determining how well a school is serving and educating its student-athletes. Use of these graduation rates as a performance measure ultimately results in a reductio ad absurdum situation where an elite academic and athletic instutition like Stanford is penalized because an obviously articulate and well-rounded athlete such as Tiger Woods did not formally graduate before turning pro.

A Relevant Indicator? Not Here
And not only that, the NCSA decided to weight graduation rates equally (each counting one-third) with the academic and athletic ratings. We could probably live with its inclusion if its weight was substantially minimized, but not as it currently exists. Nevertheless, here is the NCSA list. See Table A below.
Table A. NCSA Division I Power Ratings

Ok, so we have no problem with many of the schools at the top – HYP, Duke, Stanford, Rice, the other usual suspects… But look at some of the more dubious schools that piggyback a high graduation rate (and not much else) into the top 50 – UMass-Lowell?? Bentley?? Coastal Carolina?? The NCSA cannot be serious.

According to the NCSA, Bentley Does Better Than Cal & Texas as an Academic/Athletic School
Additionally, consider the schools who do not have athletes who would normally be inclined to leave school early for the pros, train for the Olympics or seek more playing time elsewhere (not even benchwarmers leave Harvard). The NCAA penalizes schools with transfers under its current metric for determining graduation rates. Therefore, the Ivies, W&M, Furman, Drury, etc., all fare well in Table A because of the disproportionate weight given by the NCSA to graduation rates. The bigger state schools that have excellent academics and athletics, yet are more vulnerable to market forces and playing time considerations – Michigan, UNC, Virginia, UCLA, Cal – are all penalized using the NCSA method.
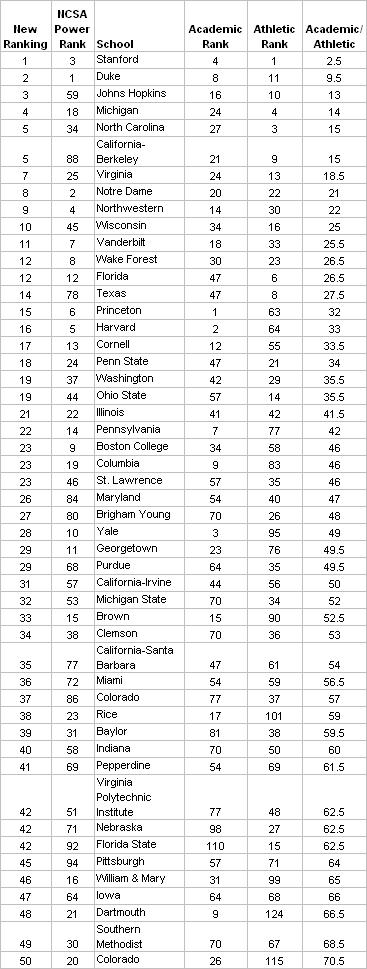
So let’s take a look at what the NCSA should look like, by eliminating the graduation rates and simply comparing academic success and athletic success. See Table B below.
Table B. Division I Ratings (US News + Sears Cup)

That’s more like it. Stanford is in its rightful place at #1 (how could the #4 national university and 13-time defending Sears Cup winner not be?), and all the schools we’d expect to be near the top of such a list are there. Look at some of the highest risers – Johns Hopkins went from 59th to 3d; Cal from 88th to 5th; Texas from 78th to 14th; Wisconsin from 45th to 10th.
This list is instructive in the sense that it shows which schools are getting the most out of its academic and athletic programs, but the NCSA flubs it my weighing graduation rates on par with the other two much more informative criteria. Maybe they’ll do better next year.
Update: a UCLA fan rightfully questioned us as to why the Bruins and crosstown rival USC were not originally included on our list. After a few moments of thought, we realized that the NCSA list didn’t have either school in its top 100!!! This can only mean that the LA schools’ respective graduation rates were so low that its weight carried both schools outside the NCSA top 100 D1 schools, essentially proving our point about the ridiculousness of its weighting system. UCLA (#25 US News and #2 Sears Cup) would earn a rating of 13.5 in our system, which would place the Bruins #4 on our overall list. USC (#27 US News and #5 Sears Cup) would earn a rating of 16.0, placing the Trojans #7 overall.
Update #2: After reviewing NCSA’s data, we decided a whole new post was warranted. We revamp the entire list and also take a look at how the BCS conferences stack up in our Athlademic Ratings – Revised.


