Marquette’s Katin Reinhardt Seeks Greater Consistency

Posted by Eugene Rapay on December 15th, 2016

Although Marquette lost to rival Wisconsin last weekend, one of the bright spots in the defeat was the play of graduate transfer Katin Reinhardt. He scored 13 of his 16 points in the first half and finished the day with a 4-of-6 shooting performance from long-range. Reinhardt, who transferred east after semi-successful stints at USC and UNLV, was brought in to be a perimeter threat on the wing. In his three previous seasons, he averaged 11.3 points per game and shot 36.9 percent from long range. There has not been a single season in which the 6’6″ forward failed to average double figures in scoring.

dsc_2459-1

Katin Reinhardt Needs to Excel For Marquette to Reach Its Goals (USA Today Images)

Maybe it just took the senior 10 games to find his groove in Milwaukee, but he hasn’t delivered the goods for Steve Wojciechowski thus far. Per KenPom, he holds the lowest Offensive Rating of the 10 players in Marquette’s current rotation — in fact, he is the team’s only key contributor below 100.0. He has taken 45 three-point attempts on the season (tied for the team-high) but has converted on a chilly 31.1 percent of those shots, nearly six percentage points under his career mark. Strangely, he’s even been worse from inside the arc, sinking only 28.6 percent of his two-point shots on the season. He’s the only Marquette player in the rotation who is shooting so poorly, as all other Golden Eagles are shooting above the 40.0 percent mark. What good is a space creator on the wing if he cannot make jumpers or finish on his occasional drives?

Read the rest of this entry »

Share this story

Pythagorean Consistency

Posted by rtmsf on March 17th, 2009

When Ben Allaire isn’t drumming up meaningless college basketball statistics, he’s writing about the Virginia Cavaliers over at Dear Old UVa.  RTC appreciates having Ben stop over this week to make some numerical sense of this year’s NCAA Tournament field.   

pythag-cartoon

A great man once said, “Our offense is like the Pythagorean theorem: There is no answer.”

Unfortunately, that man was Shaquille O’Neil and it’s funny because he couldn’t be wronger… er, more wrong

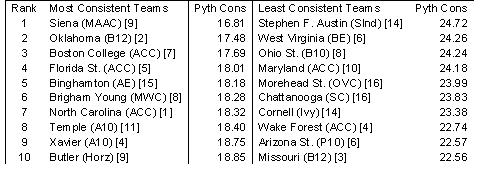
The Pythagorean theorem does have an answer and it’s going to help us examine which teams are most consistent on offense and defense together.  Last time, I gave you a scatterplot of all 65 teams’ consistency on offense and defense.  Using the Pythagorean theorem (or you might say Euclid distance), I’m calculating the distance between each point on the plot and the origin (0,0).  We’ll call this distance: Pythagorean Consistency (PC for short).

This will combine the two measures into one and tell us exactly how consistent a team is.  Now, remember as I said last time, this isn’t necessarily a measure of who’s best.  If you want that, kenpom.com has a myriad of ways of determining it.  It’s a measure of who performs according to expectation.

Let’s glance at the top and bottom ten list:

Note: Conference in parentheses; seed in brackets.  Data source: kenpom.com

consistency1

I find this to be a fascinating list. 

Read the rest of this entry »

Share this story

Brackets, Parentheses, Braces: Why You Should Be Wary of Pitt

Posted by rtmsf on March 16th, 2009

When Ben Allaire isn’t drumming up meaningless college basketball statistics, he’s writing about the Virginia Cavaliers over at Dear Old UVa.  RTC appreciates having Ben stop over this week to make some numerical sense of this year’s NCAA Tournament field. 

At its heart, the NCAA Tournament is about consistency.  Just about all the teams (OK – maybe not Chattanooga) are qualified to make some sort of a deep run.  The key is avoiding that one downer of a game that knocks a team out.

So, how should we look at consistency?

Well, it turns out there’s numerous ways to define consistency. Ken Pomeroy takes it to mean how volatile a team’s winning margin is.  John Gasaway has dubbed it “The Winehouse Factor” after the roller-coaster-like life of Amy Winehouse. Joe Morgan uses it as an adjective to describe a baseball player’s fielding abilities, a team’s starting pitching, a hitter’s swing, the running the base paths, Jon Miller’s voice when dressed in drag, and the way his wife makes mashed potatoes.

Here’s the definition I’m proposing: when team X steps onto the court, can we expect what we’ve seen previously from team X, on average?  Is team X’s offense white hot one night then colder than Jell-o pudding pops on another?  Does the defense go through stretches where they stink, then miraculously are dominant?

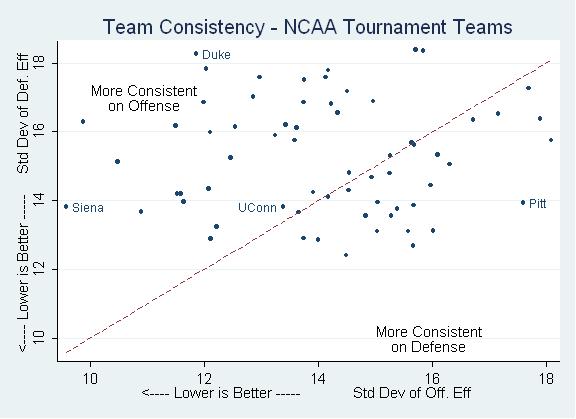
I’ve taken all 2,126 performances from the 65 teams that have made the NCAA tournament from kenpom.com and plotted the standard deviation of the offensive efficiency versus the standard deviation of the defensive efficiency.

team-consistency-2009-ncaa

Read the rest of this entry »

Share this story