No More Wisconsins: Is a Shortened Shot Clock Creating More Parity?
Posted by Will Ezekowitz on December 9th, 2015As anyone watching a college basketball game this season will have realized by now, the shot clock has been shortened from 35 seconds to 30. The NCAA made this change to inject some pace into what many decried as a slow and plodding game. And, as the NCAA itself has been very quick to point out in various news releases, this measure has worked. The number of both possessions and points per game are higher, and they have managed to do it without compromising quality of play, as the D-I average for efficiency has stayed at 102.1 points per 100 possessions (nearly identical to its 102.0 mark last year).

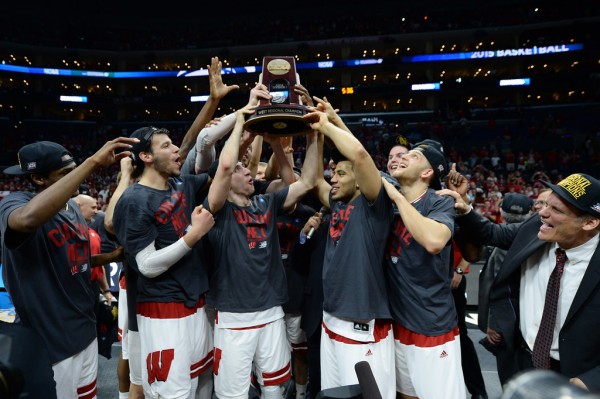
Do the New Rules Preclude Future Wisconsins From Great Success? (Hans Gutknecht/Los Angeles Daily News)
But is the outcome really so rosy? A closer look reveals that the NCAA’s change may have had the unintended negative consequence of creating more parity by reducing teams’ capacity to stylistically differentiate themselves from each other. How do we know this? Well, the standard deviations in team adjusted offensive and efficiency are already down, as you can see below.
| Year | D-I Eff. AVG | Off. Eff. |
Def. Eff. |
| 2007 | 101.8 | 7.53 | 5.89 |
| 2008 | 101.9 | 7.26 | 5.86 |
| 2009 | 101.1 | 7.46 | 5.93 |
| 2010 | 100.8 | 7.57 | 6.01 |
| 2011 | 101.3 | 7.20 | 5.73 |
| 2012 | 100.8 | 7.10 | 6.05 |
| 2013 | 100.4 | 7.06 | 6.29 |
| 2014 | 104.3 | 6.70 | 6.27 |
| 2015 | 102.0 | 6.70 | 5.91 |
| 2016 | 102.1 | 6.11 | 5.00 |
Standard deviation is the degree to which numbers in a given data set deviate from the average. So if the standard deviation of offensive efficiency has decreased, for example, then that means everyone has moved closer to the Division I average in offensive efficiency. A closer look reveals this to be the case. As of December 9, Duke has the highest adjusted offensive efficiency in the country at 120.1, per Ken Pomeroy. Next closest is Notre Dame, which is currently at 117.5. But last year, there were seven teams that ended the season at a greater than 117.0 adjusted points per possession; Wisconsin set an all-time record in the metric with an astonishing 127.9. Furthermore, there are currently 55 teams within a point per possession of the D-I average in offensive efficiency right now, compared to 43 last year and 44 from the year before that.
To take a more statistical approach, we can check how many outliers currently exist in the data set. An outlier is defined as two or more standard deviations from the average, which would right now place the upper bound cutoff for offensive efficiency at 114.2. As of right now, there are eight teams that are upper bound outliers in offensive efficiency (Duke, Notre Dame, Miami, Indiana, North Carolina, Michigan State, Virginia and Butler). The past two seasons each featured 12 teams that were offensive efficiency outliers. The difference of four teams seems small, but a 33 percent reduction in outliers is in fact quite a difference. It means that there are only two-thirds as many elite offensive teams, which could have far-reaching effects come NCAA Tournament time.

Bo Ryan’s crew was the most efficient offense in the country last season. With five less seconds to work with now, will Ryan have to slightly tweak what he preaches? (Getty)
Attributing this to the decreased length of the shot clock makes general sense: the less time teams have on a given offensive possession, the less their ability to differentiate themselves. So what are the implications of teams being close together in efficiency? Well, to the degree that efficiency is indicative of team quality, this means something of a leveling of the playing field, and we are already seeing it in action. Joe Lunardi claims that this is the worst number one line in bracketology history, and perhaps the new rules are to blame for that. Last year’s Wisconsin team gamed the system somewhat, with an incredibly slow tempo leading to an incredibly efficient offense. This year, that tempo is impossible for any team to achieve, so perhaps that efficiency may be too.
It should be noted, though, that we are comparing full seasons of efficiency with the eight or nine games of data we have for this season. That is to some degree a necessity, and though the standard deviations could very well rise, it seems unlikely that they will rise to a roughly statistically significant equality with last year’s totals. We love the NCAA Tournament because of how unpredictable it is. Even though they usually don’t, any team can beat another on any given day. This year, though, that parity could be taken to new heights, and it’s all thanks to shaving five measly seconds off of the shot clock.


I think you might be underestimating just how flat KenPom numbers can be to start the year. Not only are his preseason numbers, which still have some effect at this point, naturally conservative, but schedule strengths are very bunched at this time of year, which is a big deal since we are talking about adjusted efficiency instead of raw. On a similar date last season, Duke has the number one offense at 120.2 and Wisconsin was second with only 113.7. See the link below for full numbers at this time last year.
https://web.archive.org/web/20141211004214/http://kenpom.com/
What Matt B said.
Also, the decline in offensive efficiency deviation started in 2010 and has been going since then, making it unlikely that it is (just) the shot clock change.