


Charting Kentucky’s Defense in the Championship Game
Posted by Brian Joyce on April 10th, 2012Individual offensive statistics are easy to find by perusing a post game box score or site such as this one, but locating advanced statistics on a players’ defensive game is much more difficult to access. David Hess and Luke Winn of Sports Illustrated conducted a defensive charting project to improve upon the absence of defensive efficiency numbers. The challenge is these statistics are only accumulated through reviewing game film to assign credit and blame to each defender based on their individual defensive performance, and so this information is less readily available because of the time and effort it takes to collect.
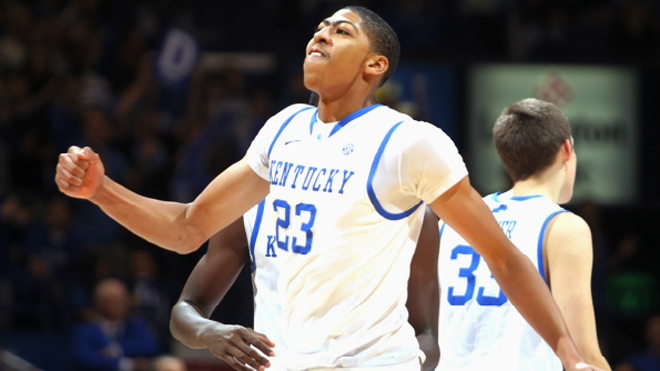
We are talking about defense, right? (AP Photo)
Hess and Winn provided the groundwork for defensive charting research, and using their original work, I tracked Kentucky’s defensive performance during its national championship victory over Kansas. Here are the definitions of the chart below using information directly from Hess’ blog, The Audacity of Hoops, which he adapted from Dean Oliver’s book Basketball on Paper, followed by my chart of Kentucky’s individual defensive statistics.
DEFINITIONS
- Taken from the box score
- Min – Minutes played
- DREB – Defensive REBounds
- Tracked by me
- FM – Forced field goal Miss – when a defender forces an offensive player to miss a shot from the field. Oliver separates FM from Blocks, but I’ve lumped them together here.
- FTO – Forced TurnOver – when a defender forces an offensive player to turn the ball over. Again, Oliver separates out Steals, but I’ve combined them, partly because I don’t know which plays the official scorekeeper would actually count as steals. One thing to note here is that a player who draws an offensive foul is always credited with a FTO, even if it’s just a moving screen.
- FFTA – Forced missed Free Throw Attempt – missed foul shots resulting from a defender’s foul
- DFGM – allowed Defensive Field Goal Made – when a defender allows an offensive player to score a field goal over him or by dribbling by him
- DFTM – allowed Free Throw Made – made free throws resulting from a defender’s foul
- Calculated Tallies
- Stops – the credit a defensive player gets for actions that contributed to ending an opponent possession. This isn’t as simple as adding FM + FTO + 0.4*FFTA, because the credit for a missed shot has to be shared with the defensive player who rebounds it. The formula is more complex than you might think, and includes a sliding weight for FM vs. DREB, based on how difficult those actions seem to be in each particular game, so I’ll just refer you to Appendix 3 of Basketball On Paper.
- ScPos – Scoring Possessions allowed by a player. This is essentially just DFGM plus a FT-related factor. I’ll again refer you to Basketball On Paper for details.
- DPoss – [Stops + ScPos] – total Defensive Possessions that were credited to (or blamed on) a player.
- Calculated Metrics
- Stop% – [Stops/DPoss] – Fraction of an individual player’s credited defensive possessions that ended with 0 points. Essentially the inverse of offensive Floor%. Fifty percent is average, and higher is better.
- %DPoss – [(Min/40)*DPoss/TeamDefensivePossessions] (for a non-OT game) – Percentage of team defensive possessions faced by an individual defender. In other words, the portion of a team’s possessions that are ended by the man a player is guarding. Twenty percent is average, and a higher number means the player is more involved with on-ball defense. Analogous to %Poss on offense.
- DRtg – [(1–%DPoss)*TeamDRtg + %DPoss*(100*TeamDefPtsPerScPoss*(1-Stop%))] – Individual Defensive Rating. Gives a player credit for stops and scoring possessions he was directly involved in, then assumes a nebulous team-average performance in the other possessions. This is the analog of offensive rating. An estimate of the points per 100 possessions that the player’s team allows while he’s on the floor. For DRtg, 100 is about average, and lower is better.
And my chart of Kentucky’s individual defensive stats from its national championship game against Kansas:
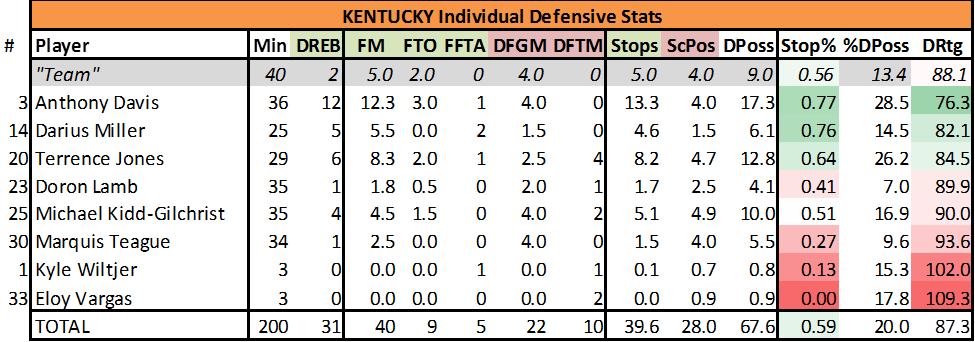
Individual defensive statistics from Kentucky's 67-59 win over Kansas on April 2, 2012
A couple of observations:
- Kentucky’s defense was again stifling, holding Kansas to 35.5 percent shooting on the night. The Cats went 38-2 because of an incredible balance of offensive and defensive efficiency, but looking at this one game, Kentucky’s defense was the difference.
- During the first 10 minutes, Kentucky did not react well on pick and roll situations, especially with Michael Kidd-Gilchrist who got hung up several times after a pick. The Cats seemed to adjust as the game went on.
- It was difficult to NOT give Anthony Davis credit for forcing missed field goal attempts because of his impact on the defensive end. He alters shots simply with his presence around the rim. There was a play in the first half with the Jayhawks’ Thomas Robinson where he backed down his defender, Terrence Jones. Davis slid over to help forcing Robinson to react. Robinson spun away from Davis (and consequently the rim), increasing the difficulty of his shot, and forcing a miss. I gave Davis partial credit (along with Jones for staying with Robinson) for forcing the miss because he forced Robinson into a situation he didn’t want to be in.
- I generally don’t give Jones enough credit for his overall play, but when I focused on defense I was impressed with how efficient he was. Jones drew the most difficult defensive assignment (guarding Robinson), but played well. Even though Robinson finished with 18 points and 17 rebounds, Jones forced him into several missed shots and he was Kentucky’s second most utilized defender (behind Davis).
- Darius Miller was also impressive, with Kentucky’s second best defensive rating, because he remained extremely active coming off the bench. While Miller scored just five points, it is easy to see why he racked up 25 minutes of play when you see his individual defensive statistics.
- It was interesting to watch the game with a defensive lens. While focusing on defense, I noticed things that I wouldn’t normally have seen such as the impact that Jones and Miller had on the game even though they didn’t excel offensively. It was a different way to take in the game, and a project I hope to continue in the future.
Brian Joyce is an advanced metrics enthusiast, college hoops junkie, and writer for the SEC basketball microsite for Rush the Court.


Thanks. JLeverenz over at aseaofblue.com charts most Kentucky games. By the time conference play starts next year, we’ll have a good idea who the best teams in the league are. It’ll be interesting if you chart Fla or Vandy or whomever is good besides UK. As far as I know, the only school in the SEC for which this kind of data is regularly available is UK. It would be great to see how other good SEC teams do it on defense.
That’s a great idea… It would be particularly interesting to chart Florida considering the Gators are expected to be pretty good in 2012-13 and defense was an issue this season.