


Close Games in the ACC: Part I
Posted by Brad Jenkins (@bradjenk) on January 8th, 2018There’s no doubt that winning close games is pivotal to a team’s success. A few bounces here and there over the course of a 30-game season can mean the difference between a protected NCAA Tournament seed in your own backyard versus a Thursday morning start in somewhere like Spokane, Washington. With that in mind, we decided to dig into the historical data to test some theories concerning close game performance in the ACC. Some of the questions we considered include: Which schools perform the best when games go down to the wire? What are the common characteristics of teams that excel in such situations? Is it player experience that matters most or game-coaching expertise? Or is it just plain luck? Are teams that win most of their very close games better prepared for postseason play? We will also review some recent extreme team performances – both good and bad – in games decided by one to three possessions. Finally, we’ll determine if history helps us predict what will happen to the ACC squads that were either very good or extremely poor in close games last season. In today’s first installment of a three-part series, let’s tackle the historical component.
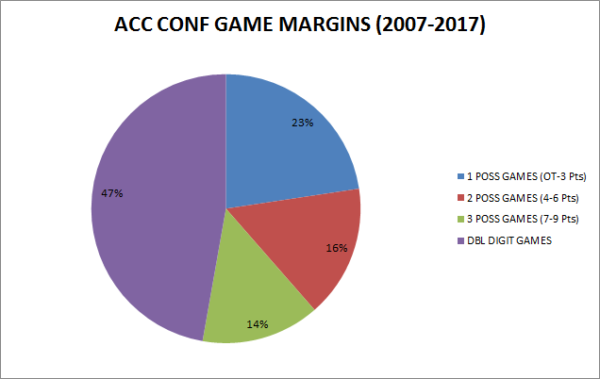
First of all, let’s look at the breakdown of victory margins in ACC regular season games over the last 11 years. As you can see in the above pie chart, approximately a quarter of all ACC league games are decided by a single possession or in overtime. And over half the time, the final margin is fewer than 10 points. This data makes it abundantly obvious that a team’s performance in so many tight affairs will have a huge impact on its placement in the conference standings. Which schools fare the best in all those tight games?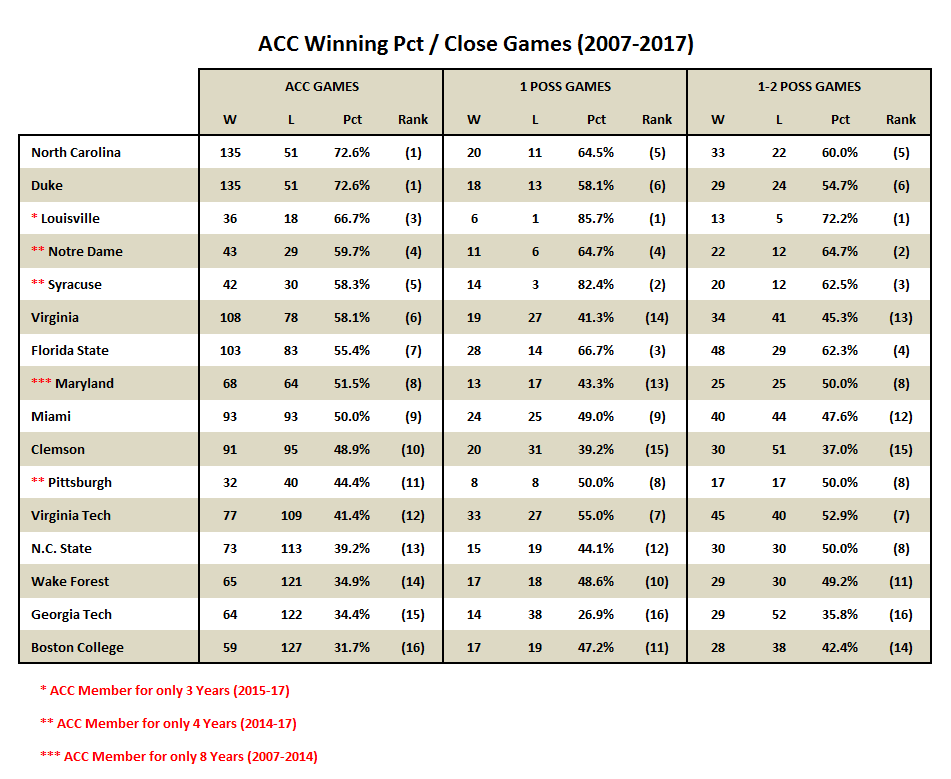
Looking at the ACC from a period spanning 2007-17, we can break out the schools into a handful of performance groups. North Carolina and Duke are the two best basketball programs in ACC history and definitely among the top-five nationally. Therefore it’s no surprise that the programs with two national titles apiece during this period also lead the way in the standings. Both the Tar Heels (fifth) and Blue Devils (sixth), however, are not quite as high as you might expect in the close-game metrics. At the other end of the spectrum, none of the four worst teams in the conference over this period — NC State, Wake Forest, Georgia Tech and Boston College — did very well in close games either, all failing to win more than half of their contests decided by fewer than seven points. Right in the middle we find Miami (FL) and former ACC member Maryland, each of which performed basically the same in close contests as they did overall.
What stands out is how well the four recent conference additions of Louisville, Syracuse, Notre Dame and Pittsburgh have performed in tight league games. The former Big East rivals have combined to win a robust 68 percent of their one-possession ACC games, a result that significantly exceeds their combined overall league mark of 57 percent. The caveat here, of course, is sample size — we should expect things to even out for these four over the long run. Four other schools have unique historical data over this period. While both Virginia and Florida State have posted similarly successful overall league numbers – winning well over 50 percent of the time – they have been polar opposites in close game performance. The Cavaliers profile more like a bottom-level ACC team in nail-biters while the Seminoles have even outperformed the league’s two blue-blood programs in tight games. Among the schools that are near the middle of the overall 11-year standings, Clemson is clearly the worst performer. On the other hand, Virginia Tech is the only school listed that wins more than half of its close games while also posting a losing overall ACC mark.
Note that North Carolina and Duke played in the fewest one-possession games (31) among the 11 permanent ACC schools. It turns out that there is a relationship between the quality of a team and how many close games it plays.
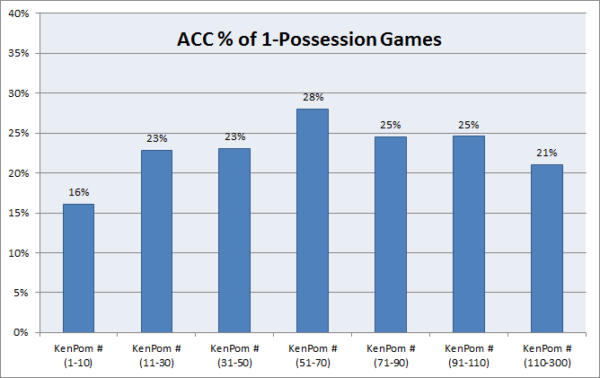
Grouping those 11 teams by final KenPom ranking reveals a small bell-curve distribution showing teams at either end involved in fewer close contests. This is not at all surprising, of course, since the best teams are likely to blow out the weaker ones on a regular basis. But it leads to the following conclusion: For good teams, winning close games is probably not as good of an indicator of team excellence as is not being involved in them at all. In the next installment of this series, we will play Myth-Buster and test some popular theories concerning the salient factors involved in winning close games.


