Analyzing Advanced Metrics: Does Florida Have What It Takes to be a Championship-Level Team?
Posted by Brian Joyce on November 28th, 2012It’s November, and that is far too early to come to any major conclusions in college basketball. However, the Florida Gators opened up the 2012-13 campaign in dominant fashion. Nobody who has played Billy Donovan’s team has yet to finish a game within single digits of the Gators. They put a good Wisconsin team away by 18 points, beat Middle Tennessee State by 21, and wore down rival Central Florida by 13. But is Florida a team that could end up as a national champion at the end of the year? We know enough about the makeup of national championship teams as a result of 10 years of advanced statistics that it is not out of the question to begin to hypothesize.
There are a couple of general principles that have been established from the data available at Ken Pomeroy’s site. Before we get into that, it is important to remember that a lot can change from now until March. While he wrote the following passage regarding individual player stats, it is still somewhat applicable here. Before proceeding, we should all read Pomeroy’s “small size sample oath” to keep in mind the limited scope of the statistics and the fluidity of the numbers over the next several months.
I, (state your name), understand that the player stats are based on extremely limited information in mid-November. I understand that Erik Murphy is not the best college basketball player of all time and that Adreian Payne is not going to grab anything close to 43% of opponents’ missed shots nor 0% of his own team’s misses for a full season. Additionally, I understand that some of the numbers displayed on these pages are utterly meaningless at this point, like Rahlir Hollis-Jefferson’s free throw rate or anything on Jordan Vandenberg’s line. I will, to the best of my ability, preserve, protect and defend the responsible use of advanced stats for individuals in mid-November.
In analyzing statistics from the national champions from 2003 to present, there are four common denominators of national championship teams:
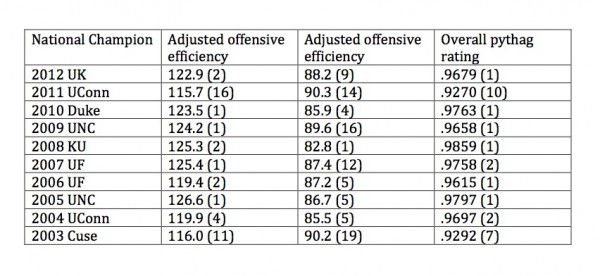
1) The national champion has never come from outside the KenPom top 10.
For all the talk about Cinderellas and upsets throughout March Madness, the college basketball national champion has always come from within KenPom’s overall top 10. In fact, other than 2011’s VCU and Butler, no team outside of the top 25 ever made the Final Four. In a way too early preview for the 2013 NCAA Tournament, there are, of course, 10 teams fitting the first rule for national championship teams:
- Indiana
- Gonzaga
- Florida
- Syracuse
- Louisville
- Michigan
- Ohio State
- Duke
- Kentucky
- Wisconsin
2) The national champion has never had an offensive or defensive unit outside the top 20.
Defense wins championships — well, so long as there is a top notch offense to go along with it. Ten years of data demonstrates that a championship team needs both a strong offense and a stifling defense. The second principle eliminates four teams from consideration (Louisville – 43rd ranked offense, Duke – 23rd ranked defense, Kentucky – 25th ranked defense, Wisconsin – 21st ranked defense).
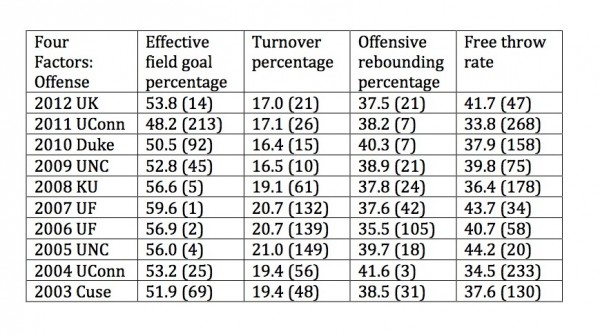
3) National championship teams finish in the top 25 in offensive rebounding percentage.
Effective field goal percentage isn’t the top category that is predictive of championship caliber offense, but an ability to gain additional opportunities to score. Strong offensive rebounding teams give their teams another chance for points, and keep the ball out of their opponents’ hands for another possession. Extra opportunities cannot be overstated as a strong predictor of championship success. It certainly doesn’t hurt to be an excellent shooting team that also grabs a high percentage of offensive rebounds.
* Exceptions:
- ’06 and ’07 Florida – The Gators didn’t need additional opportunities, because as you can see, they didn’t miss often. They had the two highest effective field goal percentages of all national champs over the past 10 years.
- ’03 Cuse – Syracuse was a late blossoming team, but just missed the top 25, coming in 31st.
There are six teams left that meet the criteria for a national championship team:
- Indiana
- Gonzaga
- Florida
- Syracuse
- Michigan
- Ohio State
Of these six, only Florida has a team in the top 25 in offensive rebounding percentage (currently 10th). Indiana is the next closest at 36th nationally.
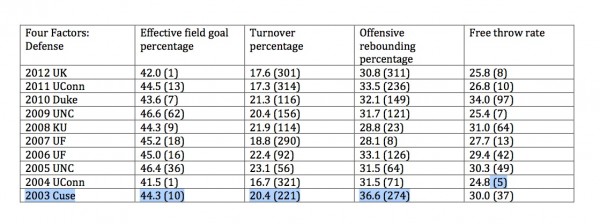
4) National championship teams finish in the top 20 in defensive effective field goal percentage.
Championship teams hold their opponents to low shooting percentages. If the other team can’t make a basket and your team is scoring while creating extra opportunities for itself, that’s a recipe for success. Florida is the only team remaining from this year’s advanced statistics that meet the previous three requirements, so does Florida have a top 20 defensive eFG%? Florida currently sits at ninth in the nation.
*Exceptions: ’09 and ’05 UNC – Both of these Tar Heel national championship teams were strong enough offensively to overcome allowing opponents to shoot higher field goal percentages than other champions.
Based on a limited sample size, if there’s a sleeper team that could cut down the news in March, the Florida Gators are it. The Gators are the only team that meets all four elements of national championship teams of the advanced statistics era. We are five games into the season, so it’s just too early to listen to a computer system. Computers don’t rule the world. Not yet anyway. But if they did, the Florida Gators might be well-situated to become the 2012-13 college basketball national champion.
Brian Joyce is a writer for the SEC microsite and regular contributor for Rush The Court. Follow him on Twitter for more about SEC basketball at bjoyce_hoops.


There are a few other things to note about KenPom’s numbers right now:
1) KenPom’s offensive, defensive, and pythag number are still influenced by his preseason projections. For example, Duke, Kentucky, and Wisconsin were all narrowly eliminated from title contention based on defense. Depending on what Pomeroy’s projections were for those teams, they might already be in the to 20 based on raw data alone.
2) This one is more important, KenPom continues to calculate data during the postseason, so while UConn and Syracuse appear to have been top ten teams, that was only after their title run. Given that most champions will play 4 or.5 highly ranked teams in the tournament, the title run itself can have a big impact on pythag and adjusted offense and defense. KenPom does not archive midseason numbers on his site, so I can’t say how far back they came from, but when it’s time to fill out brackets, don’t eliminate teams who miss these metrics by small to moderately small margins, they can (and have) made up the difference during the tourney.
This is a really good point, I really wish KenPom would provide at least a weekly archive b/c I’m sure he has it. At a minimum, preseason and post-regular season ratings would be good to see.
Great points… Will be interesting to revisit this again later in the year. And agreed… Archives would be great to check off at different points in the year.
There is a reason why Sports Illustrated’s Luke Wynn holds off on his “frauds and overlooked” column using the same metrics to compare with the AP Top 10 list until late December. Pomeroy’s system needs at least 4 weeks to “connect” the 330+ Division I teams. On December 5 of last season Pomeroy’s top 10 (yes, I have collected these irregularly going back to 2005) were:
1. Ohio State
2. Kentucky
3. Wisconsin
4. Syracuse
5. North Carolina
6. Marquette
7. Duke
8. Missouri
9. Florida
10. Kansas
Note that both teams in the Championship game were “top 10” that week and a third Final Four team was ranked #1.
On November 26, 2010 Pomeroy had none of the Final Four teams in his Top 10.
On November 29, 2009 Pomeroy had West Virginia and Duke ranked (#2 and #3 respectively), but not Michigan State or Butler.
On November 29, 2008 Pomeroy had North Carolina and Connecticut ranked (#6 and #5), but not Michigan State or Villanova.
On November 28, 2007 Pomeroy had UCLA and Kansas ranked (#6 and #7), but not Memphis or North Carolina.
On December 10, 2006 Pomeroy had Ohio State and Florida ranked (#7 and #1), but not UCLA or Georgetown.
On December 23, 2005 Pomeroy had none of the Final Four teams in his Top 10.