Predicting Half of the Finals: Villanova vs. UNC
Posted by rtmsf on April 2nd, 2009Ben from Dear Old UVa is once again back to statistically analyze the NCAA Tournament for us.
Let first begin by saying: I am a nerd. I am a complete and total nerd.
Now that my admission is out of the way, I can share with you a model I once built. In 2007, when I was in graduate school, I took a computational economics course. While learning about all the interesting mathematical techniques used to study economic systems, I decided that I would build an artificial neural network (ANN) to predict the point spread in Virginia basketball games.
Basically, an ANN is a statistical model that finds complex and often non-linear relationships between the inputs and the outputs. In this case, most of the inputs are culled from that outstanding website, kenpom.com and the outputs are the point spread.
I set up the point spread as a function of the opponents’ characteristics. When UConn beat Gonzaga by five on December 12th, the model estimates the spread as a function of Gonzaga’s season-ending characteristics of pace, defensive efficiency, turnover percentage and so on. This is known as “training the model.” The estimates are then applied to their future opponents’ characteristics to give some sense of how they’ll play against the competition.
It sounds goofy, but when I originally set the ANN up, I correctly predicted, within two points, the scores of two consecutive Virginia basketball games. It predicted that Virginia would beat Longwood by 43 points (they won by 41) and that they’d beat FSU by 5 (won by 3). I haven’t broken out the model much since then, but I did for this year’s final four.
The model is somewhat peculiar in that it does not predict spreads symmetrically: it predicts a different spread for the UNC-Villanova game when “trained” on Villanova than when it was trained on UNC.
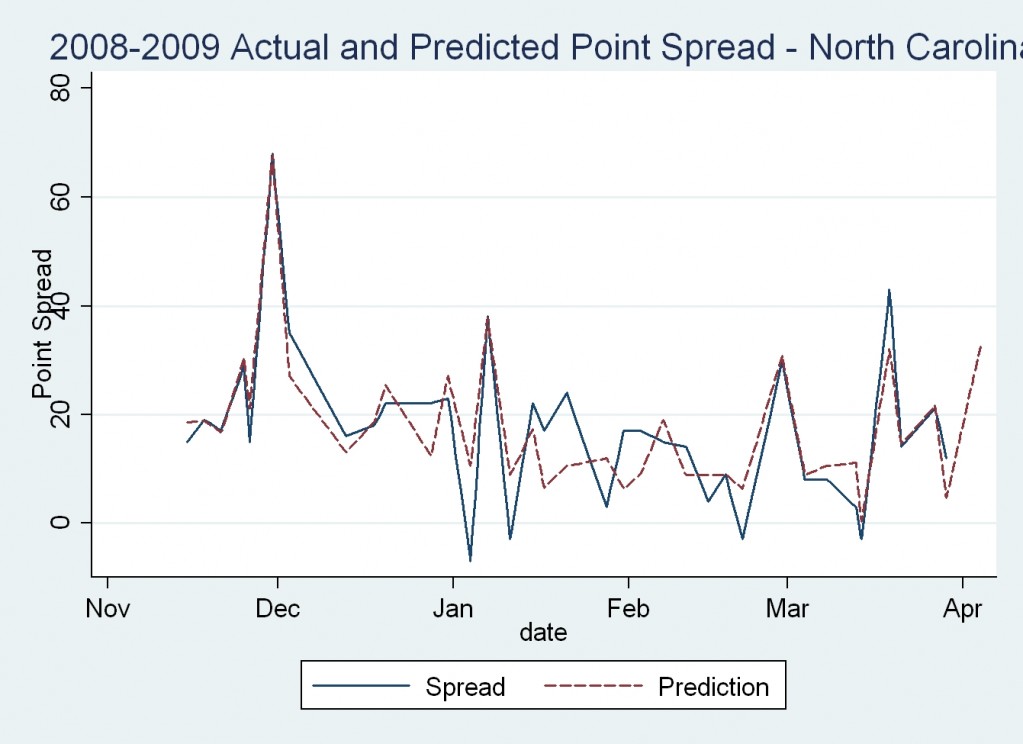
Speaking of which – let’s see how the model does for the favorite: UNC.

The model actually does a decent job predicting for UNC. However, you might notice that the model does not predict any losses for the Tar Heels. Maybe all that talk about an undefeated season wasn’t just a bunch of hooey.
You can see how out of character those losses to BC and Wake in early January were for this team. While the world was predicting a cataclysm in Chapel Hill, all the Heels had to do was put their shoes on and go to work.
The other salient feature of the model is that it predicts a complete blowout win versus the Wildcats. In fact, it predicts a 32 point win! Whoa!
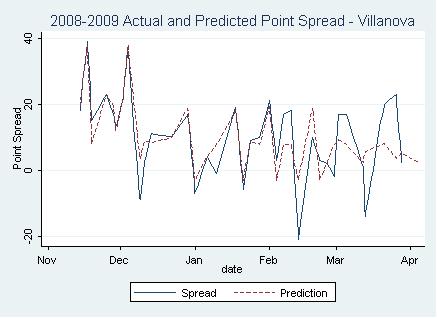
Let’s look at it from the Wildcats’ perspective:
As you can see, the model does a worse job with Villanova. It missed badly on the big loss to West Virginia in mid-February and it has predicted especially poorly in the tournament. The margins in wins versus UCLA and Duke were totally unexpected by the model.
Interestingly, the model picks the Wildcats to beat the Tar Heels by two. But how can this be? Both teams can’t win!
Ahhhh…. but therein lies the interpretation. The Heels model fit better and predicted a big win. The Wildcats one predicted poorer and a tight victory for the Cats.
I’d have to say “Heels in a walk.” My hunch is that this game will be a 20 point snoozer. I hope I’m wrong. I’ll do the other two teams tomorrow.


It would be interesting to see your “predicted vs. actual” graphs plotted as “predicted” on one axis, and “actual” on the other.