Statistical Proof Iman Shumpert is a Gunner
Posted by rtmsf on February 27th, 2009What really gets us all juiced and lathered up are statistics that appear self-evident only after someone shows you how to figure them. You know, the kind of thing where we say, “wow, that makes a lot of sense,” and yet, we never thought of it ourselves. Forest for the trees and all that.
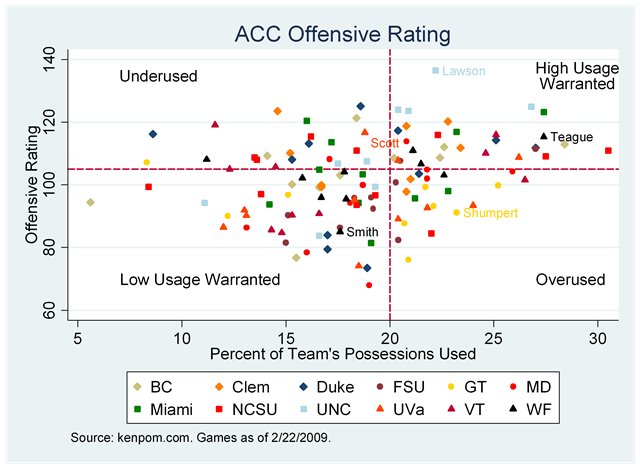
So it was with particular interest that we were alerted to a post made earlier this week by our friends at the Virginia athletics blog, Dear Old UVa. This post attempted to get to the bottom of the question about whether UVa coach Dave Leitao was properly utilizing his players on the offensive end of the court. So how would you measure such a thing? With the help of KenPom’s statistical treasure trove, they were able to cross-tab players’ offensive efficiencies with their percentage of team’s possessions used. This produced a relatively simple graphical representation of every player in the ACC which quickly shows which players are being utilized properly or improperly (see below).
On the above graph, you can easily see that Jeff Teague and Ish Smith, for example, are being properly used by Wake Forest head coach Dino Gaudio. Teague has a very high percentage of possessions used and his offensive efficiency is relatively high. Smith has a low efficiency and therefore is being used more sparingly on the offensive end. The graph can also tell you when a player might be over- or under-used. As an example, Georgia Tech’s Iman Shumpert has an efficiency in the same ballpark as Ish Smith, yet he uses significantly more possessions for the Jackets – an example of a player who is overused given his skill set at this time. The converse of course is true for players with high efficiencies but low possession utilization.
We love this stuff, so we’ll try to find some more of this kind of thing as we get closer and closer to the NCAA Tournament. The data is as rich as it will get this season, so hopefully we’ll be able to do so.


