Behind the Numbers: Defense and the Individual
Posted by KCarpenter on March 2nd, 2011Kellen Carpenter is an RTC contributor.
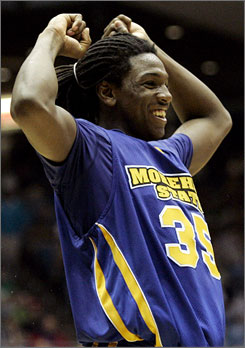
This is a story about Kenneth Faried and Morehead State. I know that it’s March now, and that Morehead State, who went 13-5 in the Ohio Valley Conference, has only the slightest chances of making a tournament splash. We have all March to talk about the contenders and the Big Dance. For now, let’s talk about Kenneth Faried and Morehead State. Actually, first let’s set the stage.
We are very good at measuring offense in basketball. We have a good sense of what is valuable and how much impact a player can make on the offensive end. The box score stats provide enough of a jumping-off point that a few bits of mathematical transformation can paint a pretty clear picture of a team or player’s impact on the offensive end. We’re talking about offensive efficiency, as good a tool as we have in college basketball. It’s so good, in fact, that we like to cheat and use opponent offensive efficiency to measure defensive efficiency, which is a pretty clever little trick. By measuring how opponents perform against a given team on average, we have some measure of that team’s defensive abilities.
The operative word here, however, is “team.” While we can tell how well a team performs by measuring their opponents foibles on offense, how do we assign individual credit? Not every player defends equally, and while I wouldn’t argue that defense isn’t a team effort, surely some players have a clear measurable defensive value over others. Defensive efficiency tells us very little about this.
Of course, maybe I was getting ahead of myself by plunging into advanced stats before just checking out the box score. Steals, blocks and defensive rebounds are all individually counted categories that suggest defensive aptitude, and indeed, after converting these categories into their tempo-free counterparts, we have a pretty good suggestion of players with specific defensive abilities. There are, however, problems with these categories. A block where an opponent retains possession really doesn’t do much good, yet those blocks are counted just the same as those that trigger fast-break opportunities. Steals generate extra possessions, but failed gambles for steals can lead to high-percentage shots. The example with steals highlights the bigger problem of what isn’t captured by the box score, namely, how good a player is at making the man he is guarding miss shots. Now, manual defensive charting and a thorough parsing of play-by-play data might be able to produce a pretty good individual opponent field goal percentage ranking, but so far, accurate and comprehensive data of this sort is just not available to us.
Now in the NBA, the fine folks at Synergy Sports have worked pretty hard to make this information available to those willing to pay for their admittedly impressive data set. It’s an ambitious yet totally achievable and realistic task to have a staff break down and tag and chart data from the video of every NBA game. This is possible with only 30 teams in the NBA. For college basketball, getting such a comprehensive data set would be exponentially more difficult with the vast number of schools, players and games. The mere cost of getting video of every college game would be a near impossible feat. So while David Hess’s diligence may provide us with this information for Kansas, those interested in this data for other teams have got some charting to do.
So if the charting necessary to measure defensive contributions is unlikely to be practiced on a wide scale for college basketball, what other analytics can get at this issue of hidden contributions? Well, if we turn to the NBA again, we can start talking about plus/minus, which is a simple measure of the change in score while a given player is on the court. In the NBA community, plus/minus has some suspicious results, but folks are willing to believe that more sophisticated versions of the measure (“adjusted plus/minus”) with lots of data points and proper perspective do a pretty good job of capturing some of the little things that good defensive players do to help their teams win. Unfortunately, the reason adjusted plus/minus works at all is largely because of the small size of the NBA and the frequency with which teams play each other. So while it may work for the NBA, lots of smart people, notably Ken Pomeroy, view the use of plus/minus in college basketball as wonky at best.
The fact is that at this point college basketball lags far behind the NBA in terms of assigning individual credit for defense, largely due to the differences in structure between the NBA and Division I (and also, arguably, the lower monetary interests at stake). So to determine the best defensive player in college basketball, to what method do fans turn? The best answer that I have found so far: Split the difference. While adjusted plus/minus and advanced defensive charting might not be prime-time ready for college basketball, we do still have overall team defensive efficiencies and tempo-adjusted box score statistics. If we can blend the two approaches, specifically with a clever rationale for deciding what parts count for what, we can come up with a pretty good list of the best defensive players in college basketball.
It’s a clever idea, and of course, someone else thought of it. The good folks at the college basketball section of Sports-Reference.com cooked up a clever way to use the Bill James idea of win shares in baseball to create a similar metric for basketball broken down into offensive and defensive components. The method for calculating defensive win shares isn’t perfect and could surely be improved, but right now, it makes sense, succeeds where other systems fail, and is currently, the best thing going in the game.
This brings us back to Kenneth Faried of Morehead State who easily leads Division I with a stunning 5.6 defensive win shares, soundly beating Tristan Thompson (4.7), JaJuan Johnson (4.6), and John Henson (4.4). While these other three might end up being more important for the rest of March, let’s take a moment and sing the praises of Faried, our Behind the Numbers’ Defensive Player of the Year.


If you’re interested, I’ve come up with an adjusted version of Dean Oliver’s defensive rating formula – http://thebasketballdistribution.blogspot.com/2011/02/estimated-defensive-rating-formula-with.html