Want to Win in the Big Ten? You’d Better Get Your Offense Right

Posted by Alex Moscoso (@AlexPMoscoso) on January 23rd, 2014

This isn’t your father’s offensively challenged but physical Big Ten. This year the league houses three of the top five efficient offenses in the nation (Iowa, Michigan, and Wisconsin). In fact, certain teams’ offenses, or obvious lack of offense, have challenged our preconceived notions of how the league might shake out over the next two months. Two weeks ago, I wrote that Ohio State, after its overtime to loss to Michigan State, still had a great shot to win the Big Ten title because of its soft conference schedule. On Monday night, the Buckeyes lost to perpetual bottom-dweller Nebraska, extending their losing streak to four games. Four weeks ago, Michigan looked dead in the water when news broke that center Mitch McGary would have season-ending back surgery. Last night, the Wolverines put on an offensive show in their defeat of Iowa by eight points in Ann Arbor. They now find themselves tied for first place with a 6-0 record in league play. Each team’s change of fortune can be explained through the evolution (or devolution) of their offense.
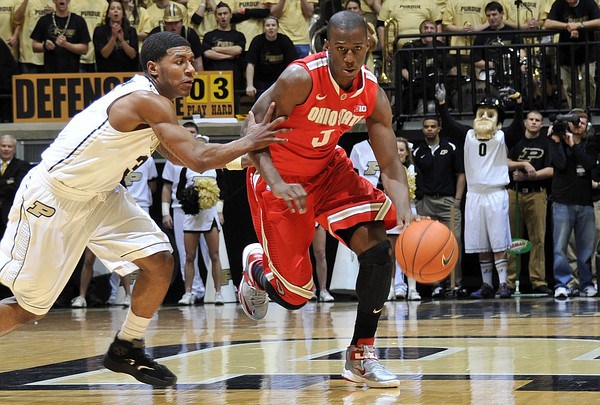
Shannon Scott hasn't been the offensive weapon the Buckeyes have hoped. And it may be costing them losses in the conference. (Sandra Dukes-USA TODAY Sports).

Shannon Scott hasn’t been an offensive option off the bench. And it may be costing them losses in the conference. (Sandra Dukes-USA TODAY Sports).

While physical play and strong defenses are still league constants, some teams are now surging due to their offensive prowess while others are sinking because of their offensive fecklessness. Take the case of Michigan, a team that has surprised the Big Ten with its undefeated record through the first third of conference play. The Wolverines racked up four losses in non-conference play, but their offense has hit another gear since. In the last five games, Michigan has not had an eFG rate below 58 percent and has averaged approximately 1.2 points per possession. Sophomores Nik Stauskas and Glenn Robinson III have led the way by averaging 34.8 PPG combined in those five games. Robinson has been especially surprising after his mediocre start to the season. On the flip side is the case of Ohio State. The Buckeyes have the best defense in the league by a significant margin, but at best a middle-of-the-road offense. The Buckeyes were hoping Shannon Scott would contribute in the scoring department off the bench, but that has not come to fruition. In their four consecutive losses, Scott is averaging a measly 4.0 PPG and Ohio State as a team has shot below 45 percent from the field in each of those games.

Read the rest of this entry »

Share this story

Big Ten Analysis: Wisconsin Leads the Way, Ohio State Right Behind…

Posted by Alex Moscoso (@AlexPMoscoso) on December 31st, 2013

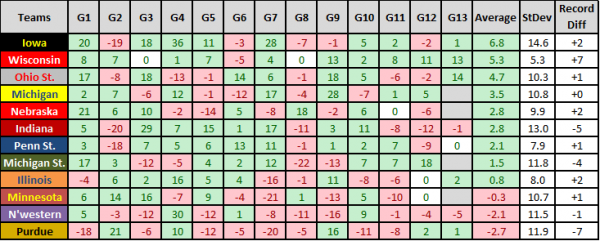
The non-conference part of the season is finally over and so is our ongoing series of measuring Big Ten teams’ non-conference performance with their preseason expectations. We have continuously recorded the score for each team’s game and compared that performance to their preseason expected performance from KenPom.com. The table below displays our final performance statistics for each team during the non-conference season. It shows whether a team underperformed (marked in red) or overperformed (marked in green) in each of their games (G1 through G13), if they’ve underperformed or overperformed throughout the season (Average), their consistency (StDev), and the change in their long-term outlook (Record Diff). For additional context, feel free to check out the December 17, December 3, and November 18 versions of this analysis.

big ten analysis table dec 30 2013

Here are our final takeaways from this analysis:

  • Iowa has been the most overperforming team this season. The Hawkeyes are no strangers to this spot of our analysis, as they’ve been the most overperforming team in each post of this series. Fran McCaffery has used his high-powered offense (ninth in adjusted offensive efficiency) and deep bench to blow out teams like UNC-Wilmington and Abilene Christian early in the season. In the Battle 4 Atlantis, they also had a successful run, falling just short of winning the championship against Villanova, but putting in an impressive showing nevertheless. As a result, they’ve overperformed by an average of 6.8 points per game. They’ve fallen back to earth a bit recently — not overperforming by more than five points in the last four games — but have still more than lived up to the hype placed upon them before the season. Read the rest of this entry »
Share this story

Big Ten Analysis: Badgers Soaring, Spartans Sinking

Posted by Alex Moscoso (@AlexPMoscoso) on December 17th, 2013

Author’s note: This analysis was performed on Sunday night, December 15, and does not include Monday’s Northwestern game against Mississippi Valley State.

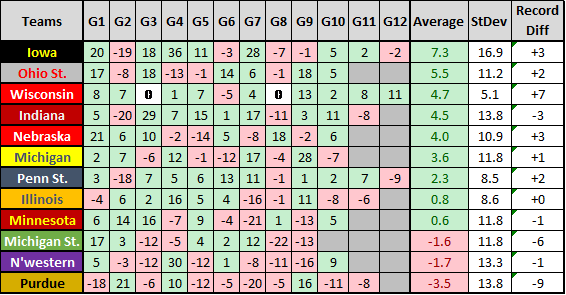
Welcome to the third edition of our Big Ten non-conference analysis.  By now, you should be familiar with how we’re measuring teams’ performances; but if not, please re-read our first post describing the methodology. In short, we’re comparing how Big Ten teams have performed against their preseason expectations according to KenPom. Since our last analysis two weeks ago, the Big Ten/ACC challenge has come and gone, and we’ve had some major interconference match-ups. Unfortunately, Big Ten teams have mostly ended up on the losing side of these games, especially last weekend as Iowa State outlasted Iowa, Arizona beat Michigan, Notre Dame shocked Indiana, and Butler held off Purdue. To see how these losses have shaken things up from the expectations viewpoint, see the updated performance table below.

big ten analysis table dec 16 2013

Here are our two main takeaways:

  • Wisconsin has improved its long-term season outlook the most and has also been the most consistent team in the Big Ten.Things are murky at the top of the league. Michigan State, Iowa, Ohio State and Michigan all have questions surrounding them or outright blemishes on their early season resumes. But the Badgers have been the league’s lone shining star by going undefeated, a record that includes seven wins against the RPI Top 100 (2-0 against the Top 50), more than any other team in the country. Furthermore, according to our analysis, Wisconsin has only underperformed in one game the entire season. Not only have they played well throughout, but they’ve been consistent in their efforts which is shown by their league-low 5.1 standard deviation (basically measuring variability in performances). Finally, Bo Ryan’s team’s long-term outlook has improved as they’re now expected to win seven games more than originally thought, which includes projected wins against Florida, at Indiana, at Minnesota, at Purdue, Ohio State, at Illinois and at Michigan State. As of right now, the Badgers are the class of the league. Read the rest of this entry »
Share this story

Examining Volume Shooters in the Big Ten: Why Jarrod Uthoff Should Shoot More

Posted by Alex Moscoso (@AlexPMoscoso) on December 14th, 2013

Who among college basketball fans hasn’t been frustrated by a volume shooter on their team? We all know the volume shooter, right? That player who hasn’t seen a shot he didn’t like. He starts off the game, seemingly, unable to buy a bucket. But then, all of a sudden, he gets hot and makes everything, maybe even the game-winning shot. Wash, rinse, repeat. The emotional roller coaster a volume shooter puts his fans through, while frustrating, is another example of the up-and-down nature of college basketball that diehards love about the sport. But how many players are really “volume” shooters? To clarify, how many players become more efficient the more often they shoot the ball? According to the numbers, the answer is not many, and they’re likely not the players you’d expect.

Jarrod Uthoff is the type of player who gets more accurate the more shots he puts up.

Jarrod Uthoff is the type of player who gets more accurate the more shots he puts up.

For this post, we did a quick analysis to determine the Big Ten’s volume shooters. To start, we only looked at players averaging double-figure points per game and measured player efficiency by using true shooting percentage to take into account the full spectrum of scoring opportunities: three-pointers, two-point field goals, and free throws. We used “true” shots (the denominator of true shooting percentage) as the measure of quantity or “shots taken.” Next, we counted each game as one observation and plotted each player’s game efficiency and quantity of shots on a graph. Lastly, we ran a simple regression analysis for all players to determine which ones had the most positive relationship between efficiency and the number of shots taken. From this analysis, we found that Iowa’s Jarrod Uthoff (10.3 PPG), Wisconsin’s Ben Brust (12.0 PPG), and Frank Kaminsky (14.7 PPG) were the three players with the most positive relationship between efficiency and shots taken. To illustrate this, the graph below maps each player’s regression line with one another. As a comparison, we included the regression lines of the Big Ten’s leading scorers: Michigan’s Nik Stauskas (18.9 PPG) and Penn State’s D.J. Newbill (18.5 PPG). Keep in mind that a regression line maps a player’s expected efficiency given the number of shots he takes in a game. Click on the graph for a larger view.

Read the rest of this entry »

Share this story

Offensive Variation and A Short Word about Defense

Posted by nvr1983 on March 19th, 2009

When Ben Allaire isn’t drumming up meaningless college basketball statistics, he’s writing about the Virginia Cavaliers over at Dear Old UVa.  RTC appreciates having Ben stop over this week to make some numerical sense of this year’s NCAA Tournament field.

What the analysis thus far has told you is how consistent a team is, without regard to how good they are.  In theory, a team could be consistently abysmal and do well in its Pythagorean consistency.  Granted, that team would be unlikely to make the big dance, but we wouldn’t have controlled for it.

Take a Pitt as an example.  We’ve seen that Pittsburgh is a maddeningly inconsistent team in terms of offensive efficiency.  As you probably have guessed, it’s a major function of their over-reliance on DeJuan Blair, but it’s a tad bit more subtle than that.  Pitt is first overall in the country at offensive rebounding, again as a function of Blair’s obscene board work.

This reliance on offensive rebounding makes them susceptible to foes; if Blair gets in foul trouble, they have trouble producing points.

Furthermore, they don’t shoot that many free throws relative to their field goal attempt (in an attempt to get more offensive rebounds?).  Free throws can be a consistent and efficient way to get the ball in the hoop.

Back to the main point: perhaps none of these reasons matter for Pitt to succeed.  Maybe Pitt is so outstanding, even their bad times are good times.

That’s why I’ve “devised” a measure of offensive consistency relative to the offensive efficiency.  Basically, I’ve just divided the standard deviation of offensive efficiency by its mean. Statistically, this is known as the coefficient of variation (CV).

The CV often used to assess how wide a distribution of numbers is.  It has an added wrinkle here in that teams are trying to minimize the top (low variation) and maximize the bottom (high offensive efficiency).  Thus, teams want this to be as low as possible.

Think about it like a dart board. The main goal is hit the bull’s-eye. Do you hit it once every ten shots, but otherwise are all over the place or are you consistently off by three inches? Really, you want to hit the bulls-eye often and when you miss, you want to be close to it.

Here are the top/bottom five teams seeded fifth or below in the coefficient of offensive variation:

Rank Top Performers Off CV Bottom Performers Off CV
1 Oklahoma (B12) [2] 0.0954 Illinois (B10) [5] 0.1533
2 North Carolina (ACC) [1] 0.0980 Pittsburgh (BE) [1] 0.1501
3 Duke (ACC) [2] 0.1059 Memphis (CUSA) [2] 0.1438
4 Syracuse (BE) [3] 0.1093 Michigan St. (B10) [2] 0.1418
5 Washington (P10) [4] 0.1119 Louisville (BE) [1] 0.1417

I guess this answers our conjecture about Pitt, but also raised a number of questions about Memphis and Louisville: two teams that many have winning it all.  Will they have enough firepower to last eight games? You have to wonder.

I assume that no one is surprised to see Illinois tops at the bottom considering they’re (1) in the Big 10 and (2) that debacle against Pitt.  Michigan St. has been pretty awful at times as well.

On the left side, we have OU. Jeff Capel has put together a great offensive group in Norman.  Jeff, if you’re reading this, Charlottesville is lovely this time of year.

UNC is no surprise at #2.  The secondary break is king, as is Ty Lawson (when he plays).

Duke is a surprising #3.  I think most people think of Duke as been rather sporadic on offense because they rely on the three so much.  Not so, they can hang with the top teams in the country on offense.

Lastly, I’d like to note that had we not included only the top five seeds, Siena would’ve been tops still.  Fran McCaffery’s crew is really solid on offense. Fran, if you’re reading this, Charlottesville is lovely this time of year.

A final word on filling out your bracket, I’d hoped to do something with defense before today. Alas, it was not to be.  I’ll still probably come up with something about it, but it won’t help you fill in your bracket.  Be cautious with teams that force a lot of turnovers.  From all the analysis that I’ve done, teams that force a lot of turnovers aren’t very efficient on D and are likely to get upset.

Share this story

Correlation Betweens Wins and NCAA Bids

Posted by nvr1983 on February 16th, 2009

With Selection Sunday coming up in just a few short weeks, fans of teams across the country are starting to analyze their team’s results looking at “quality wins” and “bad losses” (Aren’t they all?), digging into obscure computer formulas that analyze strength of schedule, margin of victory, and even more esoteric statistics. However, sometimes it is better to keep it simple. One of the better examples of this comes from Stephen Greenwell (h/t to Patrick Marshall of Bluejay Basketball for pointing this out) who decided to look at the simplest correlation of them all: wins and NCAA tournament bids.

Steven looked at the results from the 2005-06, 2006-07, and 2007-08 seasons and stratified teams based on the number of wins they had that year regardless of their strength of schedule or any other factor. The results are below:

Read the rest of this entry »

Share this story