Big Ten Analysis: Starting to See a Regression to the Mean
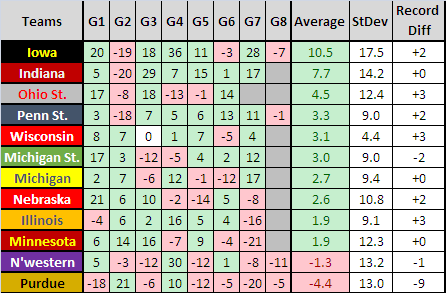
Posted by Alex Moscoso (@AlexPMoscoso) on December 3rd, 2013A couple weeks back, we analyzed each Big Ten team’s current season performance and compared them with their preseason expectations. In short, we compared each team’s win/loss margin to its preseason expected outcome according to KenPom. Since then, there have been several more games played, including the various Feast Week tournaments, and we’re starting to get a clearer picture of who has played well (or not). In order to include all the tournament games, we had to make some revisions in methodology. We won’t bore you with all the details but suffice it to say that we used KenPom projections throughout. Below is our updated table measuring performances of each game, the average, standard deviation, and season record differential to date.
Here are the three primary takeaways:
- Iowa is still the most overperforming team and it is statistically the most inconsistent team. Iowa is beating its expected preseason outcomes by an average of 10.5 points per game. This large margin is due to the Hawkeyes blowing out a number of inferior opponents. But Fran McCaffery’s team also has been the most inconsistent Big Ten team (it carries the largest standard deviation of point differential at 17.5). Aside from their blowouts, they have one ugly win against Nebraska-Omaha and two underperformances against Xavier and Villanova. Iowa went into the Battle 4 Atlantis hoping to get some marquee wins and make a statement that they are worthy of their Top 25 ranking, but they still have some convincing to do after getting down big to Xavier before coming back to win in overtime. They also lost to Villanova in overtime after carrying a double-figure lead. For now though, Iowa is still the most overperforming team in the Big Ten and their long-term prospects look good as they’re expected to win two more games than expected during the preseason.
- Purdue is the most underperforming team and its long-term outlook has taken the biggest hit of all the Big Ten teams. Not many people who actually watched Purdue were fooled by their undefeated record going into the Old Spice Classic. The Boilermakers had to eke out wins against inferior teams on a few occasions and have never looked like a team that knows its identity. Still, it was hard to foresee the complete unraveling that occurred over the weekend, but unravel the Boilermakers did. First, they were trounced by Oklahoma State in the opening game. The next night they lost by 15 points to Washington State, a team expected to finish dead last in the Pac-12 this season. Finally, the Boilermakers had to go down to the wire to beat 260th ranked Siena — winning in the last minute — to avoid going 0-3 in Orlando. Matt Painter’s squad has been underperforming against its expected outcomes by 4.4 points per game and they are now expected to win nine fewer games than projected in the preseason (Butler, at West Virginia, at Northwestern, Wisconsin, at Penn State, Minnesota, Indiana, at Nebraska, Michigan). Right now, Purdue does not resemble a team capable of competing against the top half of the Big Ten.
- Regression to the mean is showing itself as some schools return to reality. As anyone involved in statistics knows, more data means better results. So as we have more games with which to measure performances, we see teams falling back to what they were originally projected. Look no further than teams like Illinois and Minnesota. In our previous post, Illinois was expected to win five more games than projected but that has now reduced to an improvement of only three games. Illinois’ inability to shoot the ball has almost cost them a loss in their last two games against UNLV and IPFW. They’ve been able to win despite their shooting woes because of their outstanding offensive rebounding (42 percent offensive rebounding percentage, 10th in the country) but do not expect this to carry over into Big Ten play. Minnesota has also worsened since our last post. They went from a two-win improvement for the season in our last analysis to even with their projected expected wins as of yesterday. The Gophers’ problems are a result of their poor half-court defense, which I wrote more extensively about last week.
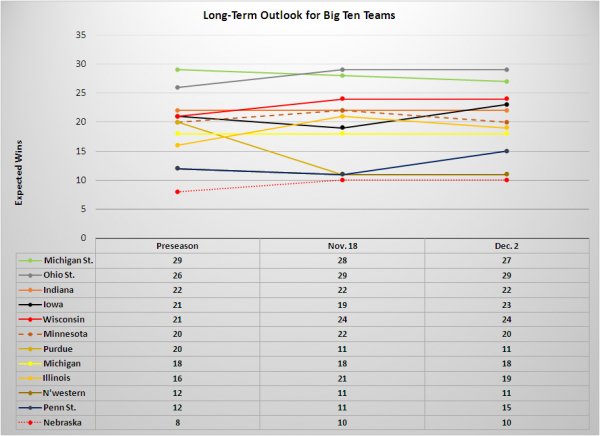
Finally, we created a graph to track the total number of expected wins at three different points in the season (preseason, the November 18 column, and yesterday). Click on the table to see it in full size. From this graph, we can see that Iowa and Penn State have improved the most since our last analysis, adding an additional four wins to their season. We will continue to keep track of this throughout the regular season.


