Profiling Elite Eight and Beyond With Pomeroy
Posted by rtmsf on March 17th, 2010This is an idea we’ve had bouncing around in the dome for a while now, and since we’re not smart enough to actually do a bunch of number-crunching analysis with regression formulas and all that other statistical nonsense, we’re going to do what we know how to do — eyeball it. (note: if you want a more data-driven analysis, visit Vegas Watch for a region-by-region breakdown) We’ve taken a look at the Pomeroy numbers for the last five seasons (2005-09) to get a sense as to the type of offensive and defensive efficiency numbers that constitute your typical Elite Eight/Final Four/Runner-Up/Championship team. We know that all of these teams are pretty darn good — but can we draw any conclusions based on the past five years of historical data that might give us a clue as to how we should be looking at this year’s bracket?
Here’s the list of roughly thirty or so teams with the strongest efficiency differentials in the 2009-10 season (sorted as such): that far right column is the key number for our purposes. The greater the efficiency differential, the more dominant a team tends to be. Remember that both the offensive and defensive efficiency statistics represent the number of points a team scores over 100 possessions of basketball. +120 is really good for offense, while less than 90 is really good on defense. Anytime a team’s differential approaches +30 points or more, we’re reaching rarefied air in college basketball. (note – Pomeroy doesn’t provide historical data prior to past years’ tournaments, but we still think there is some value in looking at his final ratings because the likelihood that a team significantly improves or regresses during the snapshot window of the NCAA Tournament is small). If you don’t follow Pomeroy regularly, you might be a little surprised at the placement of certain teams versus some others. Have a look…
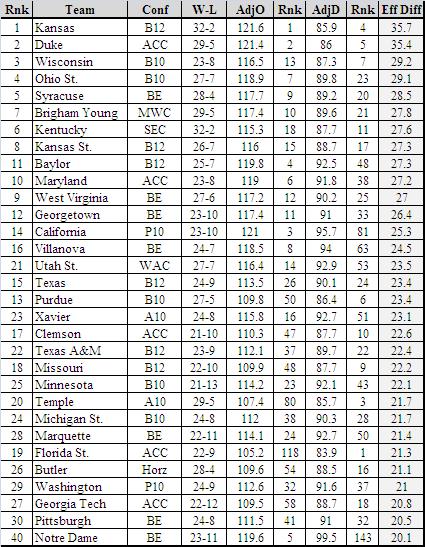
So what, right? Well, let’s see if we can use the historical data that we have from Pomeroy to make assessments of this year’s batch of teams and their prospects.
National Champions
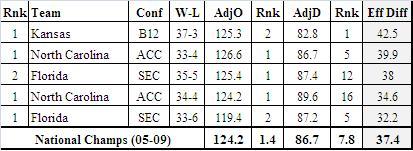
Let’s first take a look at the last five national championship teams. What jumps out at us immediately is that they’re all offensive juggernauts. Every one of them is ranked first or second in offensive efficiency. These teams know how to score the ball. Defensive efficiency is a little more spotty, but they’re all pretty good (<90 and ranking in the top twenty). The average differential is really high at 37.4 points per 100 possessions, and all of them easily reach the +30 threshold in that regard.
2010 Profile: There are only two teams that have the “look” of a national title contender in this year’s bracket: Kansas and Duke. The Devils and Jayhawks are the only two teams with +35 efficiency differentials by a big margin (next best: Wisconsin and Ohio State at a shade over +29), and they rank #1/#2 in terms of offensive efficiency. You’d be doing well from a Pomeroy standpoint to pick either of these two to win it all.
Runners-Up
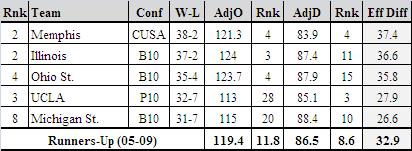
Looking at the five runner-up teams from 2005-09, we notice right away that these teams’ defensive efficiencies are generally just as good as those of the champions, but where they fall off significantly is on the offensive end. Great teams can make a handful more scoring plays a game, even against a great defense, and that appears to be where the separation happens.
2010 Profile: Whoever you didn’t pick above, you probably would want to pick here as your runner-up. The separation between those two teams and everyone else is fairly substantial this year.
Final Four
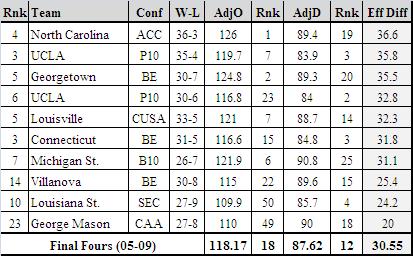
And now, the real fun begins. How to distinguish from all of these other teams? What you’ll notice below is that nearly all of them are north of +30 when it comes to the efficiency differential. Of the three Cindys, only Mason remains a real shocker with a pedestrian offensive efficiency and good-but-not-great defensive efficiency. The average Final Four team is not markedly different than the average Runner-Up, but as you’ll see below, nearly every F4 school has a top 25 defense. In quite a few of the Elite Eight examples, you’ll find a team with a top 10 offense that gets weighed down because their defense simply isn’t up to snuff.
2010 Profile: You should focus on teams with a top 25 defense and, in general, a corresponding offense. The few Cinderellas that make the F4 can all make stops in the clutch, but they don’t have enough offensive firepower to go further. Among this year’s field, this would mean that semi-popular teams such as Villanova, Maryland, Georgetown, Baylor and Xavier should be off your board. You may want to give more serious consideration to Wisconsin, BYU and Kansas State than you previously have, just to be safe.
Elite Eight
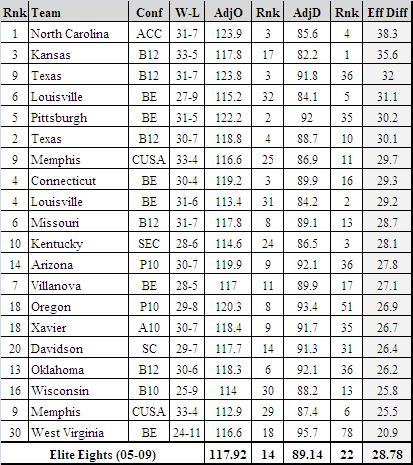
This round is where you’ll want to see a team with at least a +20 efficiency differential, but how they’re actually doing it is less important than the mere fact that they are. We note a lot of teams with really good offenses and really good defenses, but few times where they’re excellent at both facets of the game (UNC in 1997 is an anomaly). One thing to note with your brackets: every team on this list is at least a top 20 offense or defense — they have to be good at something to make it this far.
2010 Profile: Noting that E8 teams tend to be good at offense or defense, but not always both, you should examine your brackets to see if the teams you have slotted there are good at one or the other. Teams like Texas, Texas A&M, Minnesota, Michigan State and Pittsburgh probably aren’t Elite Eight caliber if you buy into the Pomeroy numbers, but some sleepers like the ones you didn’t choose above could be (Wisconsin, K-State, et al). You probably also want to avoid teams with huge ranking differentials, as only WVU made the Elite Eight with a ranking differential of over fifty spots — so, for example, Cal, Villanova, Missouri and Temple are probably way too one-dimensional to merit inclusion this deep into your bracket.
First Three Rounds
This is where it starts to get too difficult to see much in the way of trends from the eyeball method. There are too many teams and randomness in the soup. But if you believe that Pomeroy’s numbers are good at telling the story, hopefully some of the guidelines above at a minimum helped you to decide between a couple of your final teams at each slot. The first round is great and all, but the last three rounds are where the heavier points are located. You nail all of those and it probably won’t matter much whether you hit 23 or 25 picks over the first two days.


